The featured draft animation includes velocity vectors and color scaled values of the log of ozone for Jan through Dec of 1979. I truncated the upper bound of the color scale to focus on the troposphere.
Once again, the connections between tropospheric ozone and atmospheric moisture and circulations of both, are impossible to ignore for all but the most determined. That camp of scientists still assert that the southern height of the blue zone in these animations is somehow driven by heavy man-made chloro-flourocarbons (CFCs). They must believe that, because the more the blue zone grows, the more the ozone hole grows. Because they believe that, they also must believe that sloshing never looked like this before the widespread industrial production of those refrigerants.
There remains no room for H2O in their narratives, even as they study both simultaneously. A NOAA site in Boulder Colorado monitors each of these daily, including by costly air flights, but doesn’t appear to recognize their intimate connections. This seems much like an Institute of Bread and Butter Science, where the two are never actually combined. Such a combination might lead to the rapid disappearance of both, until only a crusty, smiling outline remains.
The related Bread and Butterfly Effect can also be miraculous in steering alarming climate claims around rocky facts. The more the notion of the butterfly effect, as a type of deterministic chaos, is given credence without evidence, the more bread that climate change and ozone hole promotions might be empowered to generate.
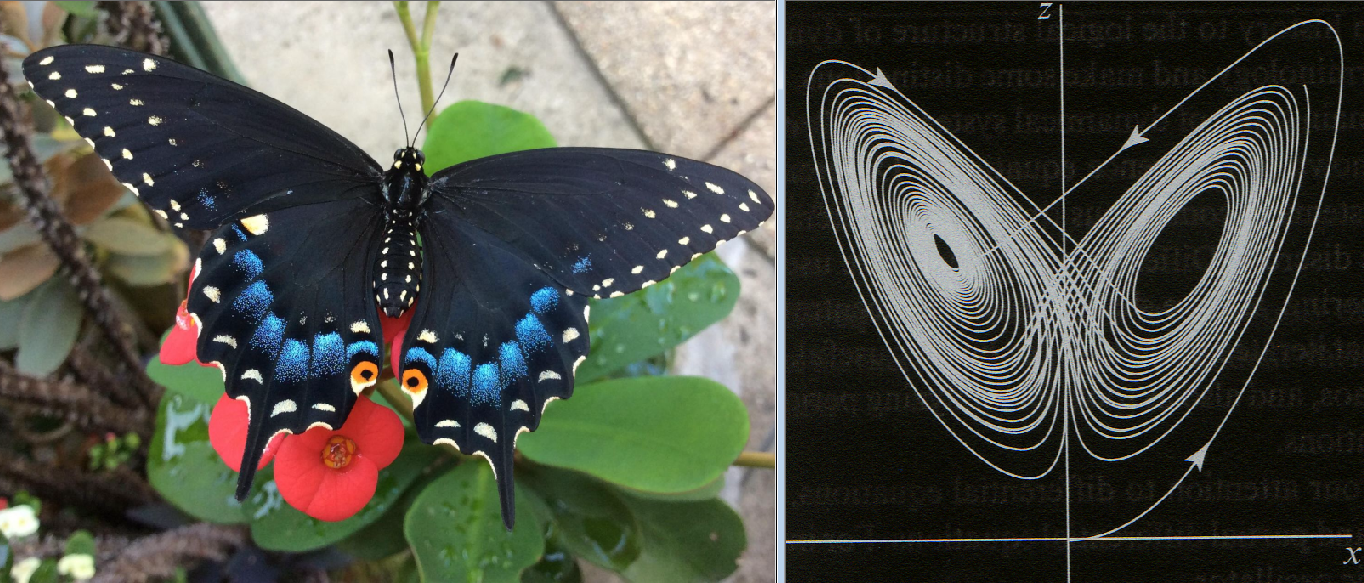
I’m not sure if Strogratz’s book notes the similarity of a strange attractor to a butterfly outline. He does refer to the popular Lorenz-fueled myth that a butterfly flapping its wings can trigger a cascading chain reaction which spawns a hurricane. Yet given the land-modulated geostrophic scale, and inertia, the atmosphere itself is much like any other variety of ocean swell and current. The sloshing has so much inertia that our atmosphere is very much a damped harmonic phenomenon over any synoptic and seasonal to decadal or longer scale one might find practical to investigate. In that damped harmonic environment, the butterfly effect will be no more plausible than the notion that a swimming oyster or even an advancing walrus, could change the course of a breaking coastal wave,
If you’d like a stroll through the Looking Glass, consider searching NOAA’s Ozone and Water Vapor Group site to find publications on connections between ozone and water vapor. In any case, awareness appears to be flooding over, around, and past that facility, with interesting new papers that happen to support the views on ozone expressed in this and older posts. Here’s an example from Zhang et al (2021) for ozone and humidity profiles over a major Asian locale.
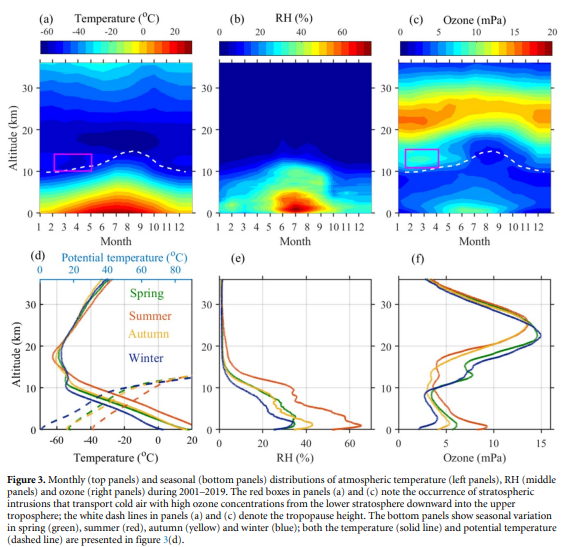
column over the North China Plain: results based on ozonesonde
and Dobson measurements during 2001–2019 Environ. Res. Lett. 16 (2021) 074053
RH stands for Relative Humidity in the central column of panels above. If you don’t see the connection between the center and the right columns yet, consider reading that paper. Or for historical background, an older post might also be of interest to confirm that Ozone and Water Vapor in the the atmosphere remain tightly correlated. Since then I’ve grown to appreciate that the superposition of lightning concentrations across any depictions of ozone-hydro connections can often add value. But perhaps that doesn’t apply in some cases, and it still is satisfying to see how moisture is recognized as a co-variate to ozone in papers such as above. From work in collaborative progress, here are some comparable semi-random profiles for temperature and specific humidity along 75S (near the South Pole) for January 1979.
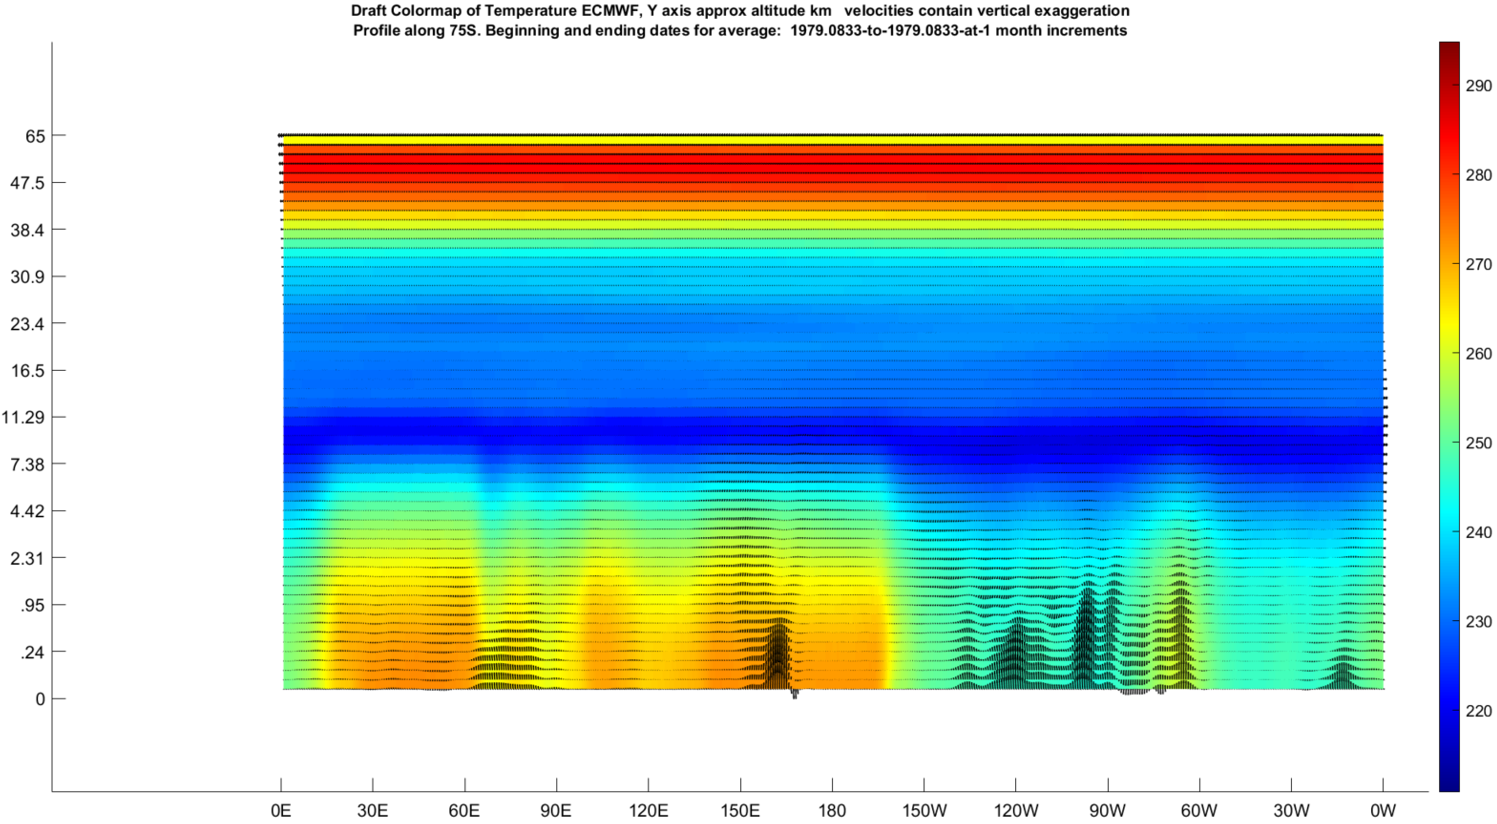
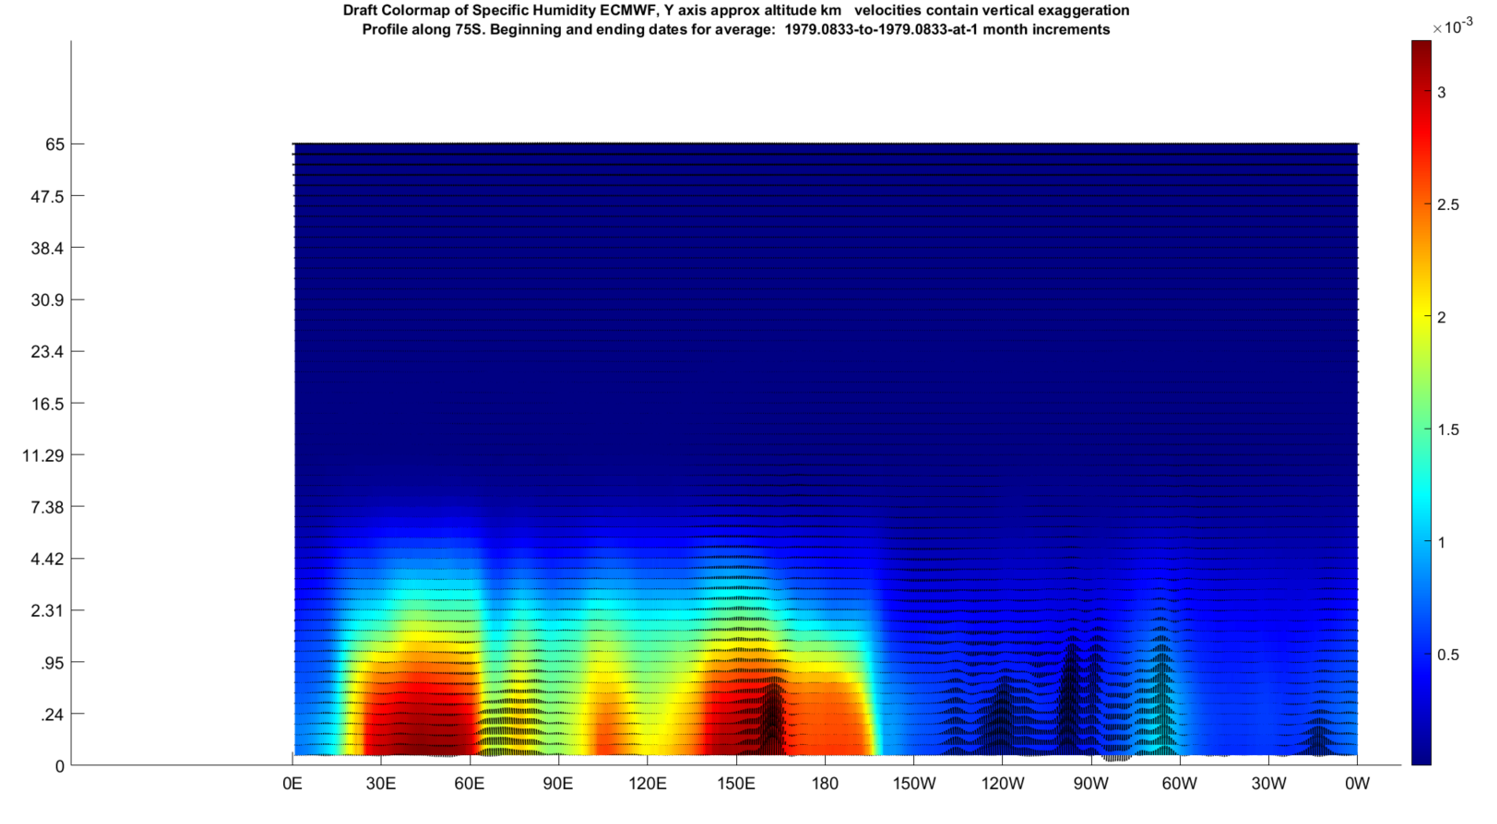
Now that I’ve roughly oriented the viewer, they might recognize that the abrupt shift in Temperature and SH, is due to the emergence of ocean geographical features. And here is an almost whimsical profile of specific humidity at the exact opposite polar latitude:
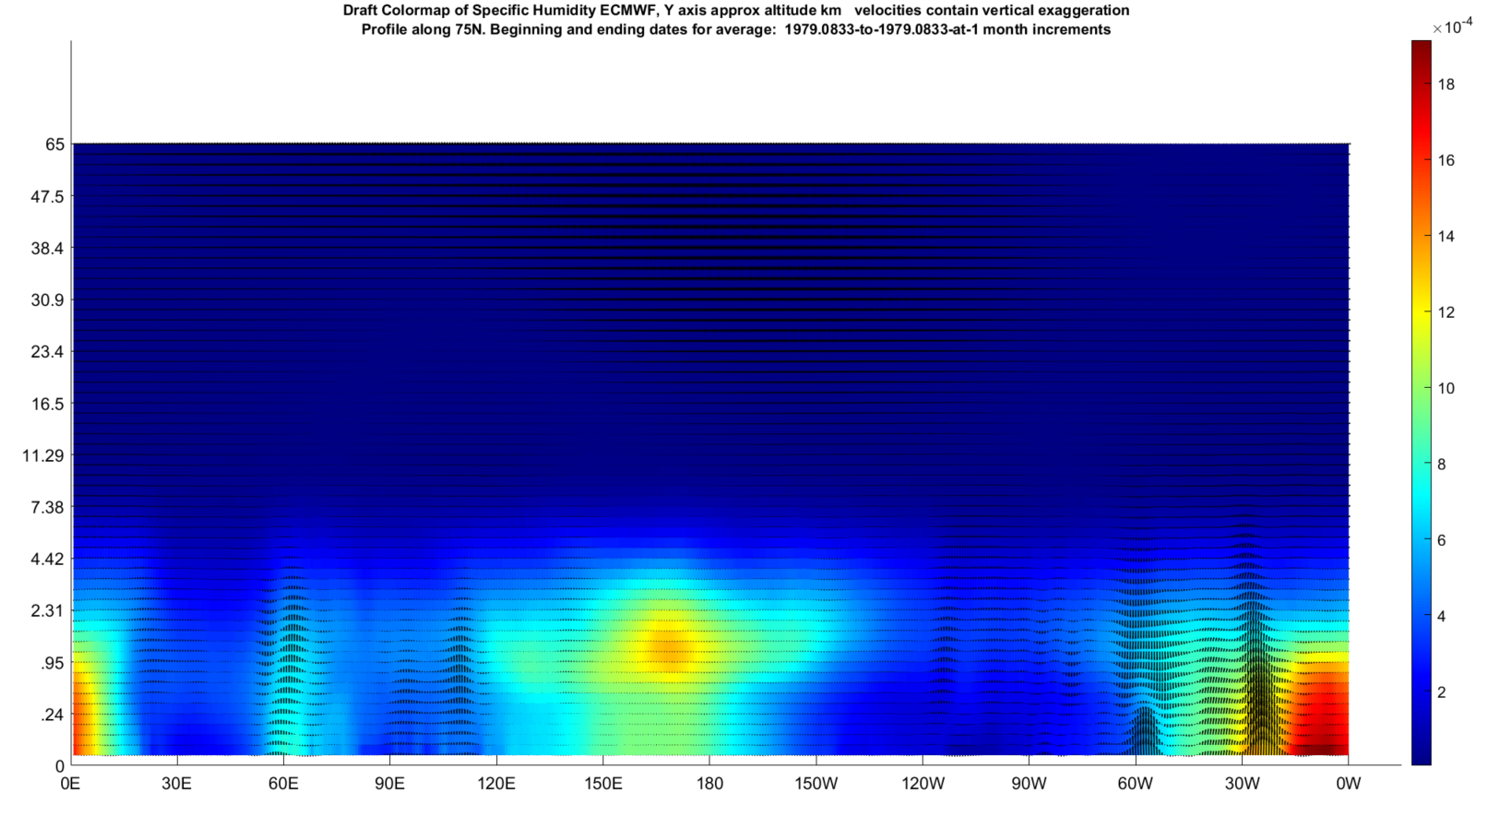
I do believe the cute yet spooky green ghost relates to the quasi-stationary roots of the Northern Hemisphere Polar Jet Stream directly above the East Siberian, Chuchki, and Beaurfort Seas. So perhaps a post for another time except to note a conceptually related recent study. And I will have to correct some of these draft images further including by reversing the sign of the vertical component of the velocity vectors. Again, Ozone is rather heavy, and yet it sloshes back and forth from north to south along with the rest of the atmosphere. In contrast, in order to hover perpetually over the South Pole (whether dormant or active) as also rather heavy molecules, and with respect to the fact that the very air itself is streaming down to the polar surface, the permanently high-flying, human – fingered, ozone-destroying CFCs must somehow get a pass from physics. This seems unsustainable and unacceptable. I’m somewhat more tuned than ever, after a recent publication on pollen and climate that I coauthored. In that paper we advanced standard notions of Stoke’s Law towards aerosol sized particles, global circulations, and more. Meanwhile, in spite of apparently universal acceptance of the Montreal Protocol, a paper that demonstrates how CFCs can hover for decades over the South Pole given their relatively massive weight, along with the prevailing downward flows of air, has yet to be published by any.
There are further papers that show how the heaviest gases find their own equilibrium with reactions and with inertia and gravity, over synoptic scales (up to the global scale). Even CFCs are found where a scientist would naturally expect them, in the groundwater. They fall from the sky as heavy and otherwise circulating molecules, and concentrate (until ultimately destroyed) within groundwater. The bread stops there in this case.
Speaking of the surface, here is a related 2 frame animation of vertical velocities at the surface in color for Jan and July of a similar if not identical year and from exactly the same source as many of the other images here (depending on the Queen’s Rules, or not):
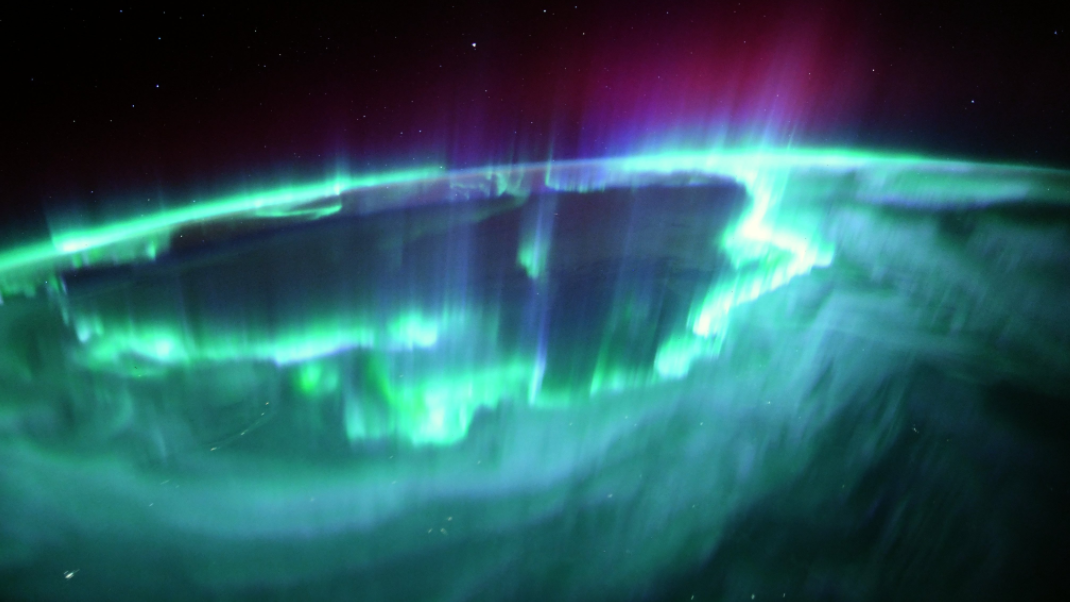
The regions of greatest magnitudes (pos or neg) of vertical velocities in the above images, besides being limited to polar regions, also appear to show a rough alignment to the Earth’s auroras. Although winds at much higher altitudes (such as the thermosphere) are documented to relate to Auroras, the prospect of lower altitude connections are not well covered in literature other than a previous post. Again this is only a blog, but perhaps the vertical surface winds may offer value in understanding much more about these brilliant terrestrial ribbons. If they reflect downwelling from precipitating auroral particles, or upwelling from degassing CO2 around polar coasts, or the most likely orographic forcing, or much that is above my pay grade, perhaps more can be learned over time. If one can assume that this aurora photo below recently taken by French astronaut Thomas Pesquet, rims Hudson Bay, then it seems likely that Water once again plays an unattributed role, not unlike its unattributed connections to ozone.
BONUS: Stratospheric Global Ozone Sloshing
For the same 12 months as the top featured image, here is an animation focused on the much higher ozone concentrations above the troposphere.
Along with other interesting covariations relating to wind and water, there is also the fact, shared with and by a mentor Bob Endlich, that over every austral winter (June through August), the Sun is not shining over much of Antarctica. Accordingly, as one might expect, without the Solar UV forcing agent, upper atmosphere ozone diminishes over Antarctica over those dark months. Believe me, I’m not trying wrap up the science of ozone circulation by writing a few blog posts. Given the covariance of ozone with humidity and winds (and to a lesser extent, temperature), there are no doubt many puzzles to keep scientists busy. Between the very natural ebbs and flows of ozone in the upper and lower atmospheres, I’m still at a loss to see things the Montreal Protocol’s way. The associated peer reviewed publications can’t all be right.
All draft, and contains opinions. All rights reserved.
ADDITIONAL REFERENCES
The Walrus and the Carpenter by Lewis Carroll | Poetry Foundation