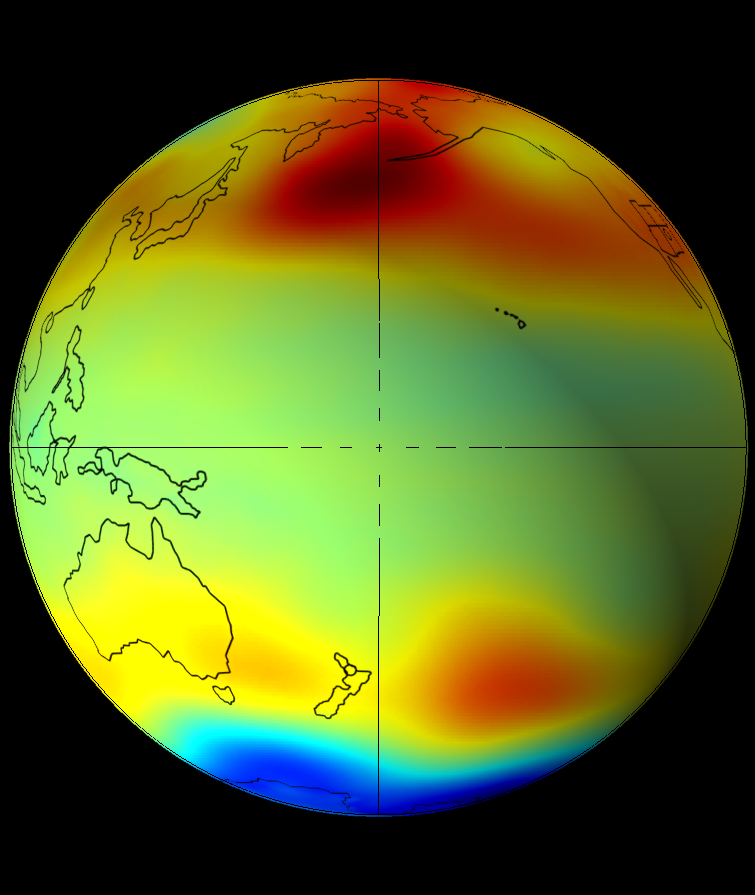
In this excerpt from work in progress, adapted from 36 years of global satellite UCAR assets [1], The parts of the planet which have trended higher in geostrophic temperature are red, and the parts which have trended cooler are blue. The parts that haven’t trended much are green and some cyan and yellow that surrounds.
Any view can help, including this view over most of Atlantic and more.
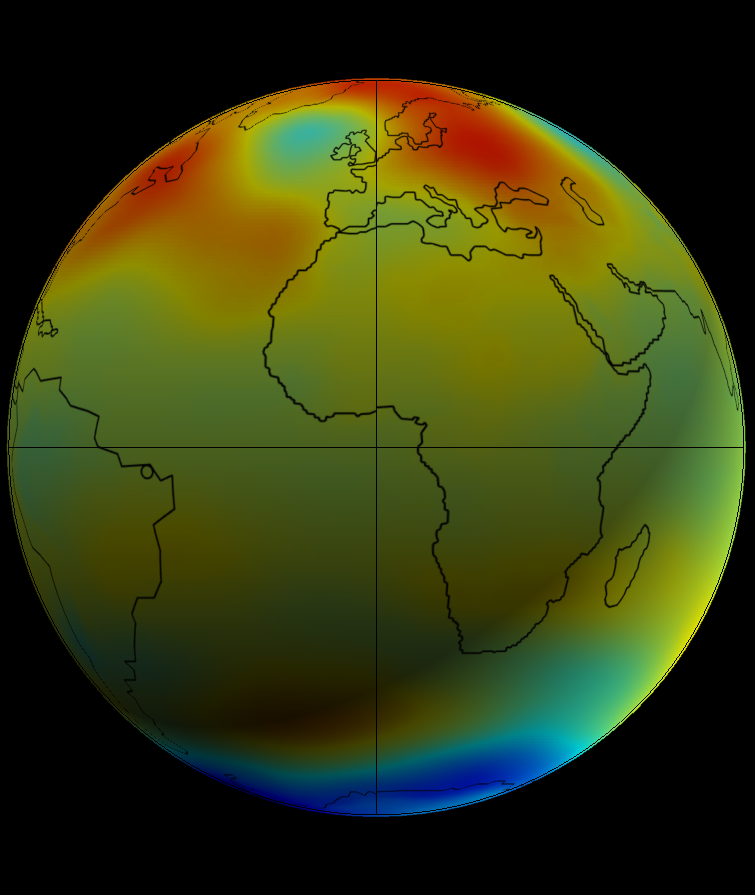
Pardon the funky lighting. I have been trying out ways to show information and with lighting applied the effects can be more clear at times and places, and less clear at others.
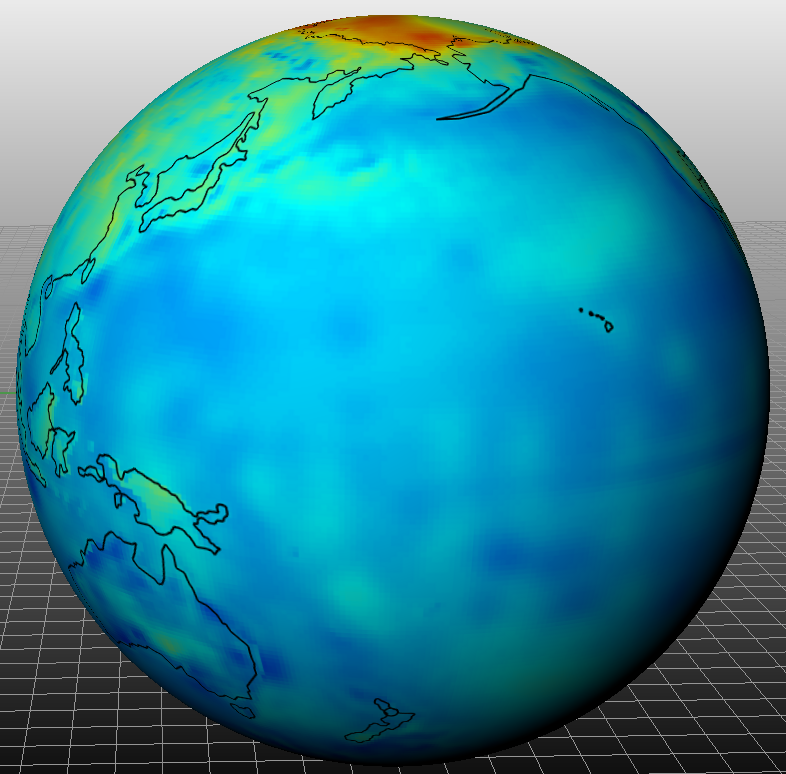
This is part of a more collaborative work. I have also been in informal contact with a NASA GISS Director on Twitter. I requested that Gavin Schmidt compare their warming history to the satellite – based trends I feature at this post. He has not recognized this specific request, and so you might bet that NASA will never compare their alarming claims to the actual data. As a follow up to that. I’ve posted this image of Surface Temperature trend I developed from UCAR’s big cousin, ERA-Interim data [2].
Unlike NASA’s claims, most of the planet’s surface is not warming. For this post as time permits, I will outline why the satellite reanalysis data that subject matter experts in meteorolgy and climate for years have trusted, appears to indicate once again that:
2/3 of the planet’s full atmosphere are not warming, and significant zones are cooling.
Other subject matter experts claim something different. Here’s a recent quote from NASA’s GISS page: “Science leaves no room for doubt: Climate change is the existential threat of our time,” said NASA Administrator Bill Nelson. “Eight of the top 10 warmest years on our planet occurred in the last decade, an indisputable fact that underscores the need for bold action to safeguard the future of our country — and all of humanity..”
Yet if their claims were indisputable, they would be able to corroborate against the satellite data I feature above. That’s the data that served much of the world’s forecasting needs for the last several decades. Again, NASA has never verified their temperature information against the ERA-I resource.
Unlike the other skeptics, I recognize that much of the Northern Hemisphere has been warming. I do so because of this graphically compelling ERA-I satellite reanalyses resource. I believe that resource quite a bit, even as I am mindful it is not perfect. This dataset may lead to a good phenomenological explanation for the entire warming and cooling pattern, including the blobs.
I have been producing web posts along with my hydrologic forecasting and research business for decades. There is a synergy in this but sometimes frictions can emerge. Robust skepticism is an important part of any scientist’s job. Any can find a way to challenge conventional explanations even while they judge no one.
Contains opinions and some facts.
References
[1] http://www.cgd.ucar.edu/cas/catalog/newbudgets/index.html#.
[2] https://www.ecmwf.int/