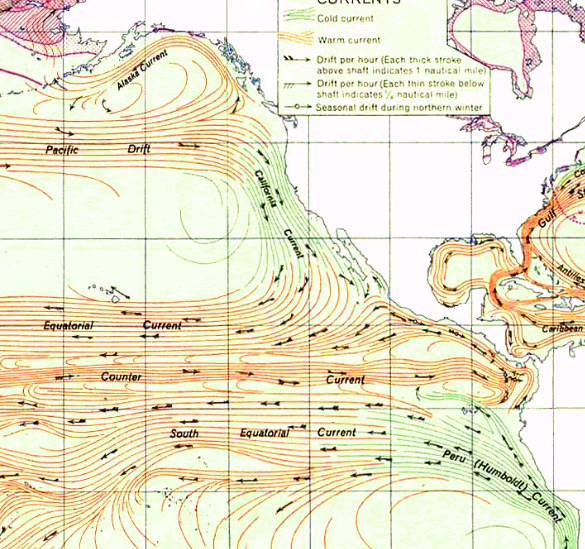
The upwelling of Dissolved Carbon Dioxide (DCD) from cold ocean currents such as the Peru (Humboldt) Current has long been as evident as the featured image cropped from a US Navy ocean current map published in 1946. The quantification of upwelling evidence continues in a low key manner in some publications and supporting data. I’ve adapted upwelling data archived at the Max Plank Institute [2] to produce trend and various other maps such as the one below.
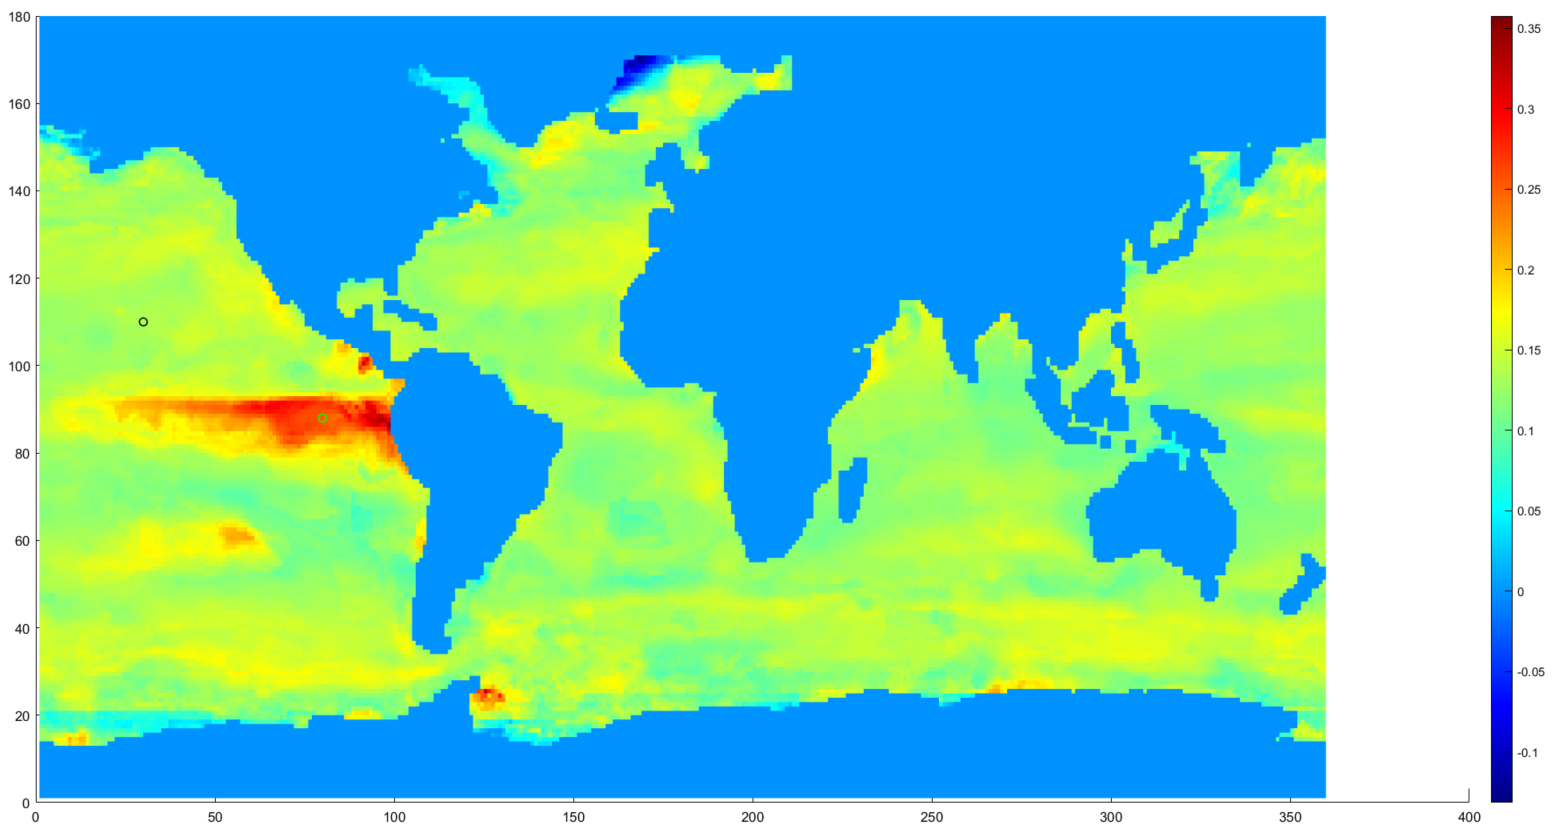
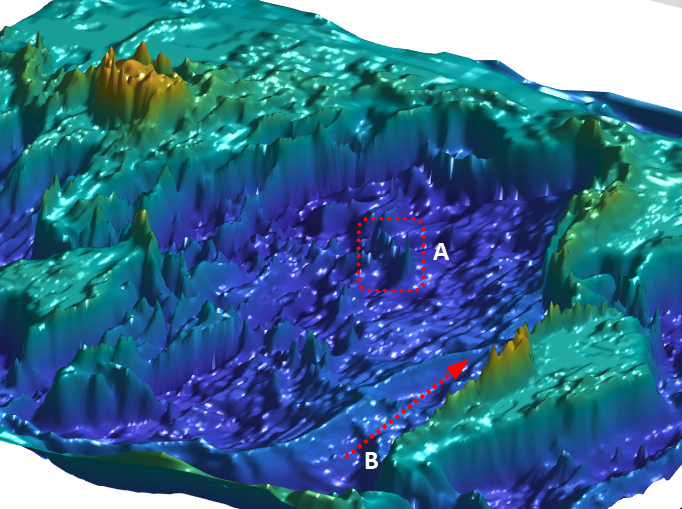
The increase over time of equatorial ocean (only) upwelling, signified by the red shades in the map above, align well with the consequence of colder Peru Current Waters upwelling towards the pelagic zone (B below). The northernmost open circle above and box A below represents Hawaii domain, where anthropogenic CO2 is asserted to be monitored.
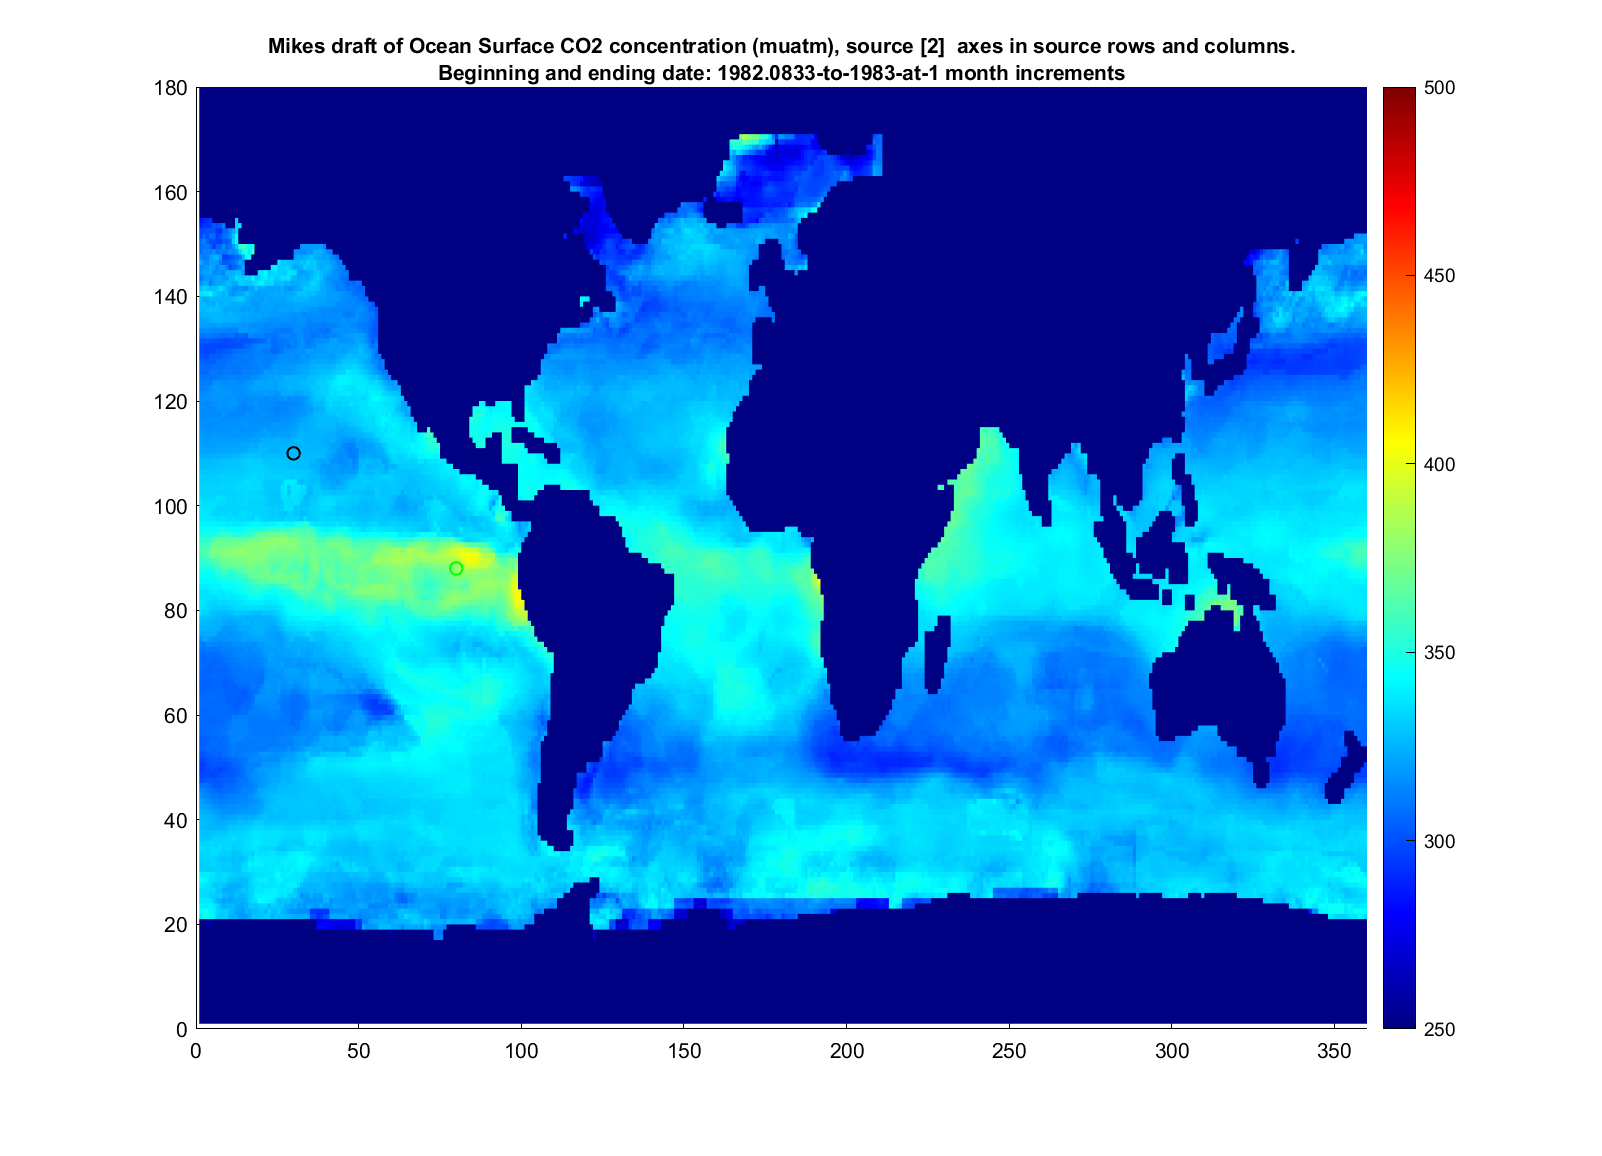
Equatorial upwelling is also evident through ocean soundings of many stripes, including ocean pH as measured by glass electrode pH meters (gephs). It seems plausible that the Mauna Loa station is primarily monitoring CO2 that has upwelled from the east, both north and south. In other words, circulation, and related eddy diffusion may ensure that Mauna Loa is surrounded by this natural ocean CO2 source most of the time. The next image is an example of these CO2 plumes for an example year of 1982.
And another draft annual map for 1990:
Other works also corroborate that again, the high CO2 plume is associated with COOLING AIR. I have also shared some of these notions via tweets.
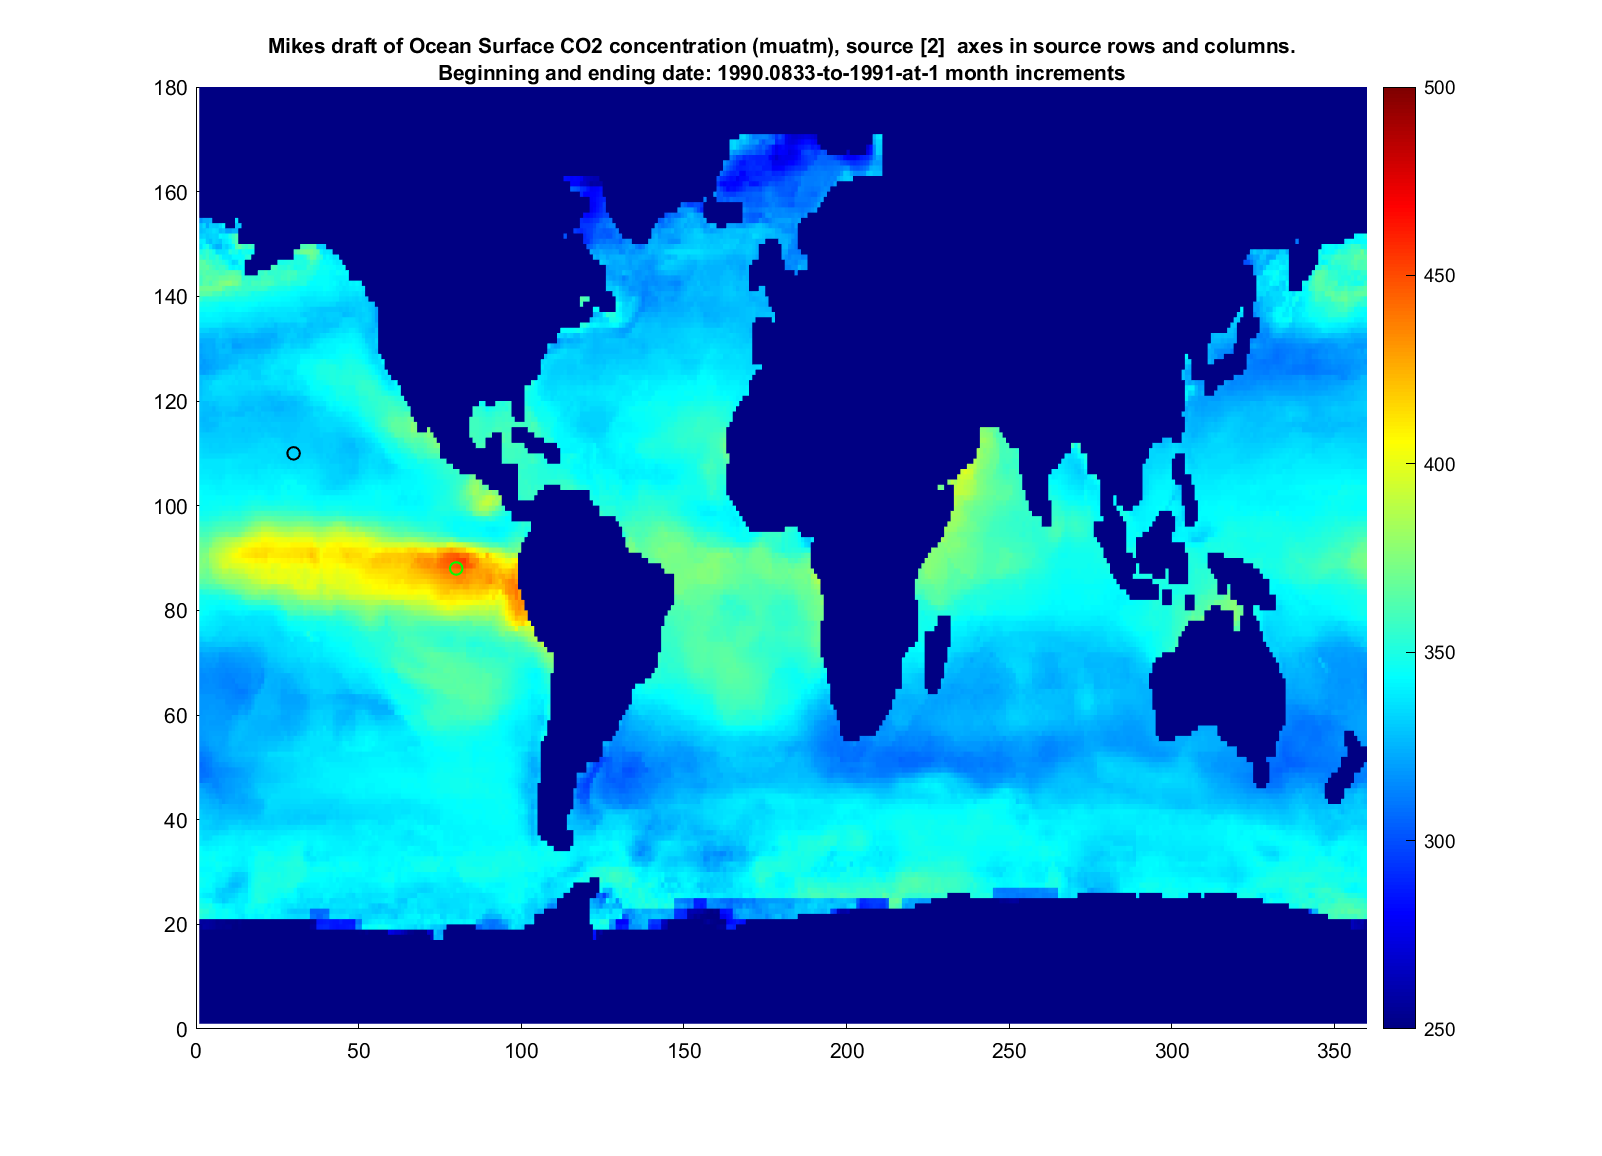
Finally for now here are some past maps and charts shared in related posts. First an example for a sampled month, which I’ve annotated with my opinion of the origins of the CO2 that is monitored at the Mauna Loa, Hawaii station.
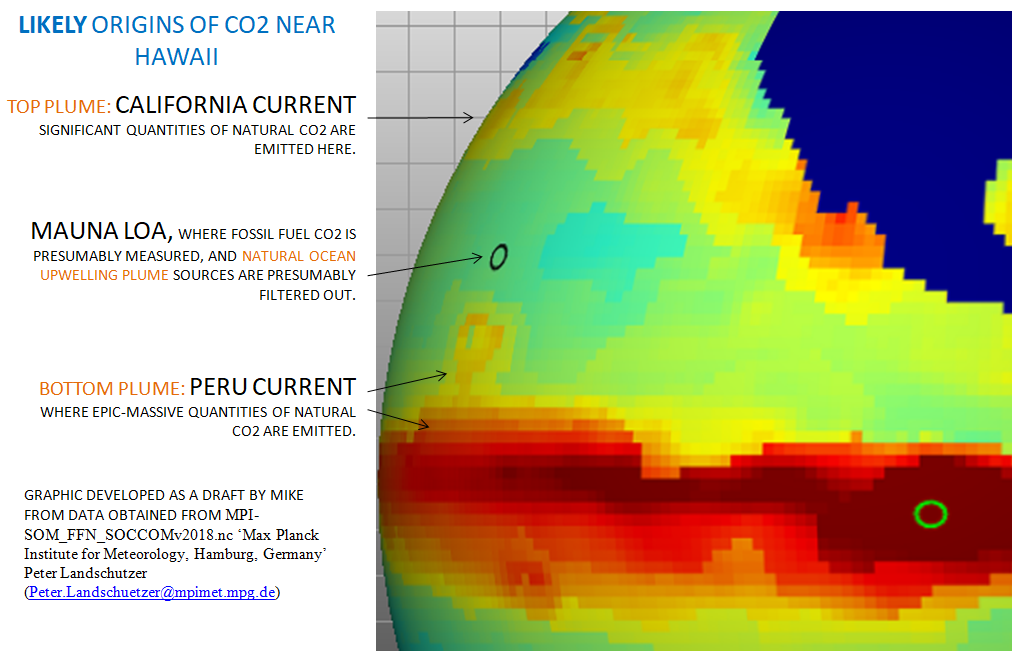
The CO2 plumes look “rowdier” because this is for a specific month as opposed to a specific year. In any case, no matter how I would map, the CO2 which associates with the Peru Upwelling Current is always higher than the Mauna Loa measurements and the rest of the ocean surfaces, as charted in draft below.
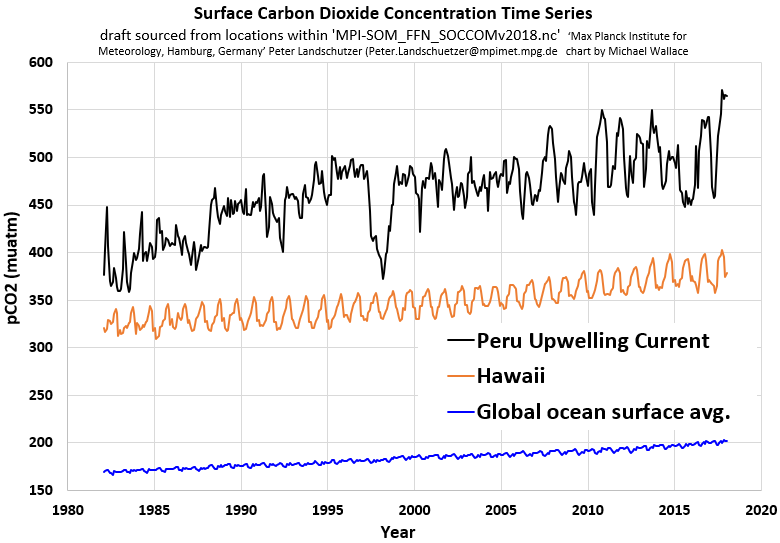
I noted earlier that circulation, and related eddy diffusion may ensure that Mauna Loa is surrounded by this natural ocean CO2 source most of the time. Given that the Peru Current CO2 plume is always higher in concentration than the CO2 at Hawaii, then the notion seems reinforced, as any who study Ficks diffusion would recognize.
From a physical perspective, all appears to make sense in this draft perspective that contains opinions.
References:
I presented related content at a JPL meeting indexed here.
[1] US NAVY, 1946
[2] MPI-SOM_FFN_SOCCOMv2018.nc ‘Max Planck Institute for Meteorology, Hamburg, Germany’ Peter Landschutzer (Peter.Landschuetzer@mpimet.mpg.de)