The narrative of global ozone’s fall and rise is largely promoted by media, based on claims from atmospheric scientists around the world. I’ve begun to work on validating or falsifying such claims, not because I want to, but because I’m interested in solar cycles and the way those impact climate. Due diligence demands that I consider the existing claims and be transparent about ozone. I’ve reached out to several leading scientists and typically that has not yielded the information I sought.
But in any case, I can still comb through papers and data to piece together their narrative and compare. The featured image for example demonstrates a possible oversight by the ozone scientists. Although most ozone experts can note the work of G.M.B. Dobson (1889-1976) that first connected the UV dots to ozone in the full atmosphere, they never seem to have explored time series correlations between this UV radiation, which again comes from the Sun, and the time series of global ozone.
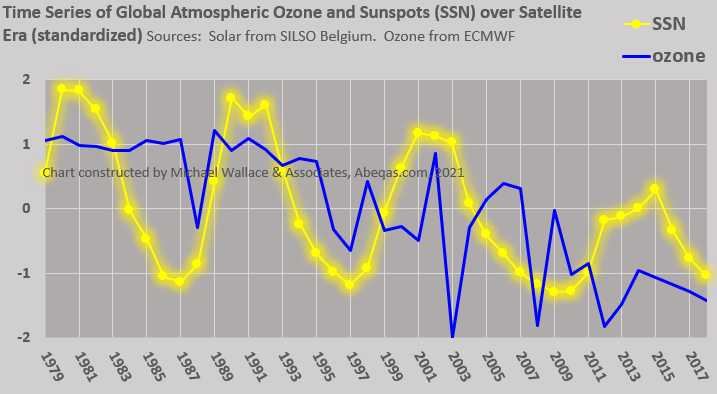
That’s important because as the featured draft image suggests, global atmospheric ozone has trended down, in sync with solar cycles. That pattern runs counter to the prevailing narrative. For example, journalists Kelsey Piper and Victoria Gill, along with their advisors including Dr. Luke Western of the University of Bristol, as well as “atmospheric chemist Susan Solomon, geophysicist Joseph Farman, and Environmental Protection Agency official Stephen Andersen” all seem to get behind this statement as reported by Piper of Vox.
“..the damage we wrought last century (by making refrigerants) has been reversed”
Other experts also mainline the assertion, as shown by these reorganized quotes from the BBC:
“The chlorofluorocarbons (CFCs) effectively began eating away at the ozone…
As a result, in 1985 a gaping hole in the ozone over the South Pole was discovered…
The Northern Hemisphere could be fully fixed by the 2030s and Antarctica by the 2060s”.
The BBC article ends with a quote from another subject matter expert ” report co-chairman Paul Newman, chief Earth scientist at Nasa’s Goddard Space Flight Centre”:
“If ozone-depleting substances had continued to increase, we would have seen huge effects. We stopped that.”
Again, according to the routine promotions, it was only due to actions by the experts, lawmakers, NGOs, and journalists who have been bravely restoring the Ozone concentrations, through their research, treaties, and shaming of the rest of us. And have you noticed something peculiar so far? The top featured chart, based on ECMWF data, demonstrates that ozone concentrations are not going back up. Rather, they have continued to drop. Solar trends likely force the global ozone trend*.
We don’t appear to have shifted ozone concentrations in our atmosphere, whether by releasing CFCs, or stopping that release. But if you will recognize solar and hydrology influences, then you might feel that the above claim may be one of the great conceits of our time.
I certainly wouldn’t want to drink groundwater that had been contaminated with CFCs. As heavy and inert manmade gases, the CFCs end up there, at the virtual bottom of the atmosphere (yes groundwater can represent the bottom of the atmosphere) or they end up in the ocean. There is no physical basis for the claims that CFCs perpetually defy gravity and powerful winds to hover over Antarctica for years, destroying enough ozone to challenge the Sun. That claim is preposterous, and atmospheric scientists, of all people, know this well.
The celebrated experts appear to not only disregard Solar controls on ozone, but as I often note, they refuse to recognize the influence of Water on Ozone in the atmosphere. Every drinking water treatment engineer knows that ozone will be relatively quickly destroyed by water (i.e. will undergo reactions so that no ozone remains). The water treatment industry deploys ozone to sterilize water and kill all of the germs, but they simply can’t mass produce ozone for that purpose in the presence of high humidity. Ask them.
Or consider the satellite data again. Here is a hopefully compelling set of frames for Ozone at top and Water Vapor at bottom (via Specific Humidity) for January of 2014, for the integrated full atmosphere to illustrate. Color scales capture full ranges. Caveat: not exactly the full atmosphere thickness, but I’m only taking what ECMWF is giving. In this case, the top of the data for these integrations ends at approximately 65 km altitude.
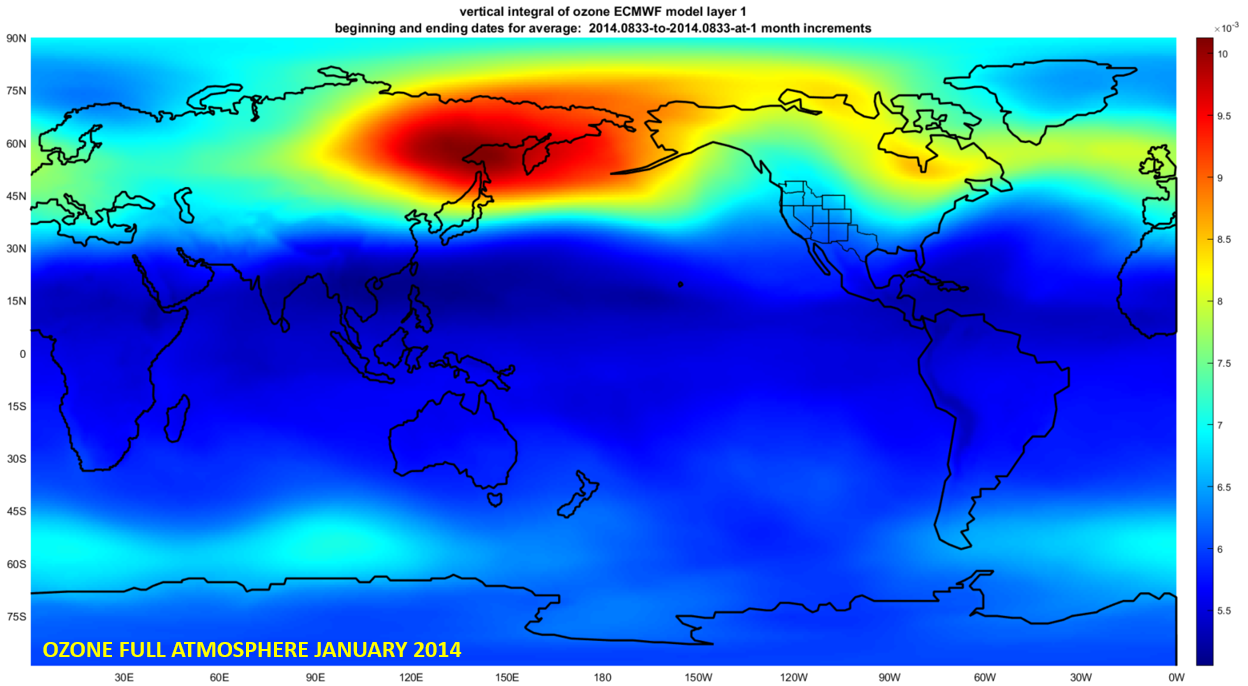
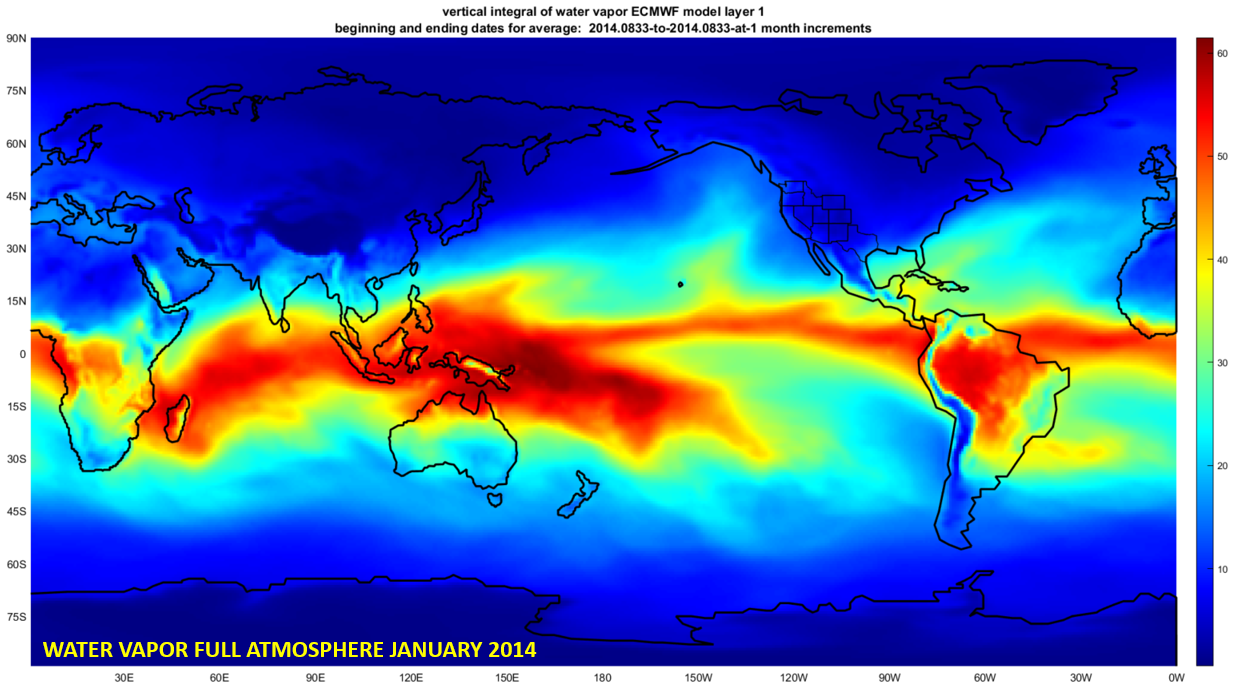
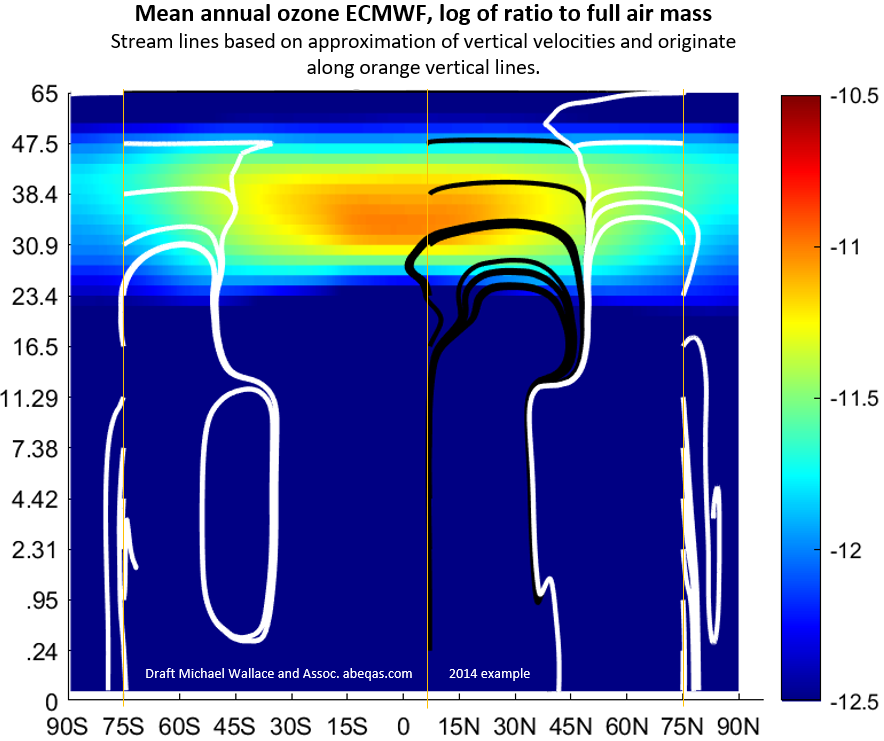
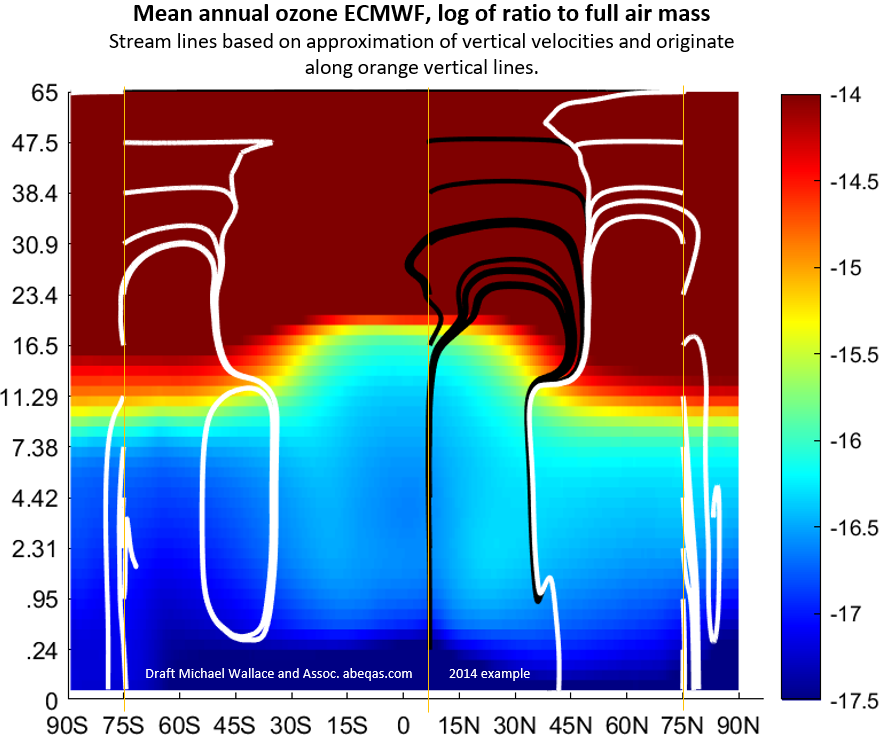
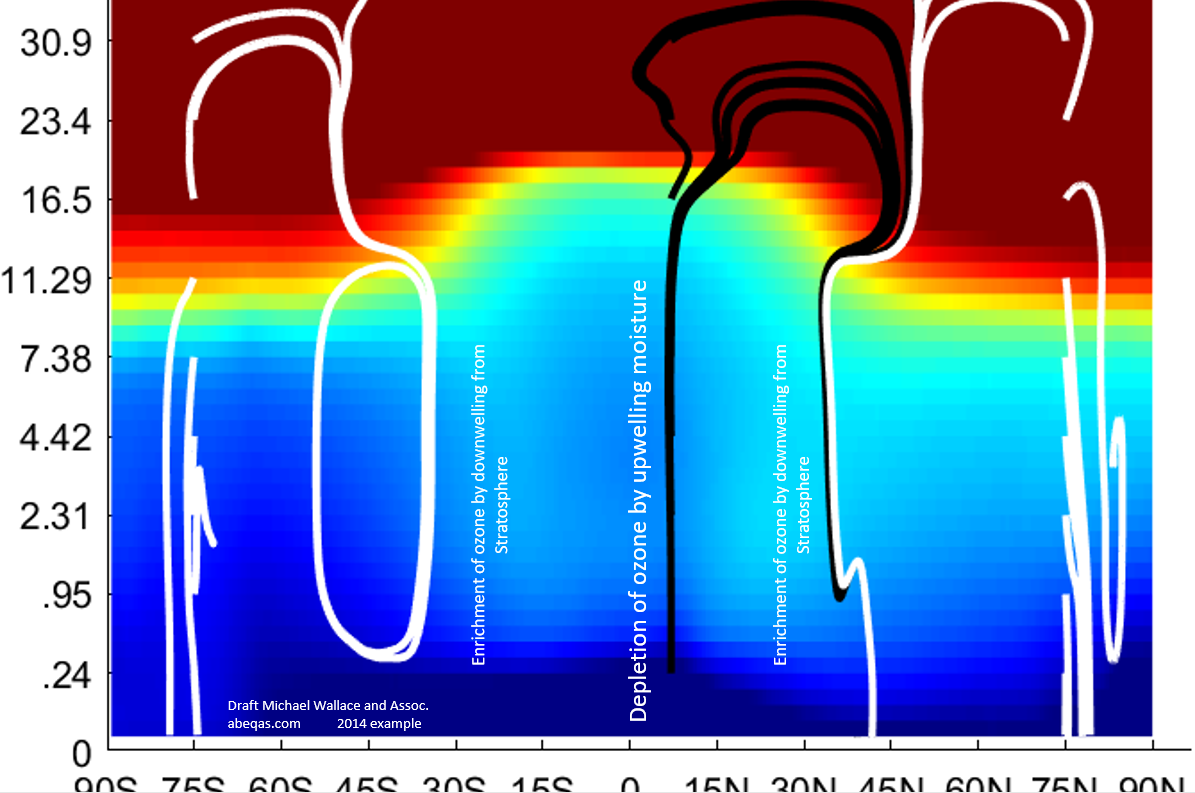
As the Wicked Witch of the West might paraphrase, Water Liquidated the Ozone. To complement that focus on January, I’m including an average profile set of all ozone for all months of the same year, 2014. The first two images below simply break out the ozone concentrations between the stratosphere first, followed by the troposphere second. The third includes annotations that describe related key ozone features in the troposphere as modulated by Water and the stratospheric ozone (as I interpret). I’ve included a rough approximation of streamlines based on vertical and meridional velocities. Each streamline emerges from one of the orange vertical lines.
To recap these final frames and more:
- Solar UV produces ozone in the stratosphere
- Diminishing Solar leads to diminishing ozone
- Atmospheric moisture typically depletes ozone as well
- Stratospheric ozone circulates down from the stratosphere to our troposphere, particularly through convergent downwelling streams of air. These convergent streamlines are interesting in their own right, as a valued mentor and colleague has noted to me, and for whom I owe some additional atmospheric plots.
- Upwelling equatorial moisture streams deplete some of that tropospheric ozone
- Leading atmospheric scientists do not appear to recognize these patterns. Instead, they routinely point to heavy anthropogenic chlorofluorocarbons (CFCs) as the primary causal factor for ozone patterns in our global atmosphere.
- CFCs are too heavy (and inert) to explain any atmospheric ozone trend or pattern, in any slice of the atmosphere, over any time frame.
This is only a blog, and all is draft, including the next animation. It’s not a log of DU but rather a log of the mass fraction of ozone for each ECMWF layer. And I’ll be tweaking my approximation of vertical velocities. The streamlines will accordingly look a bit more squashed but it will be better, even while the basic patterns shown are preserved. One should also keep in mind, as I should, that the vertical axis is based on ECMWF model layers, and I simply assign selected elevations on the left. Those are not evenly distributed elevation-wise or pressure-wise. You can confirm by noting that the 16.5 km elevation is halfway up the axis even though it is only approximately one quarter of the total height displayed. This is a common convention in any case.
This post is under construction towards a goal of singling out a number of atmospheric ozone claims, and comparison to the actual data from the ECMWF satellite reanalysis resource (ERA-Interim).
*consider attributing this possibly novel solar ozone time series exploration even though it is draft work in progress. Or find another paper that precedes. All rights reserved.