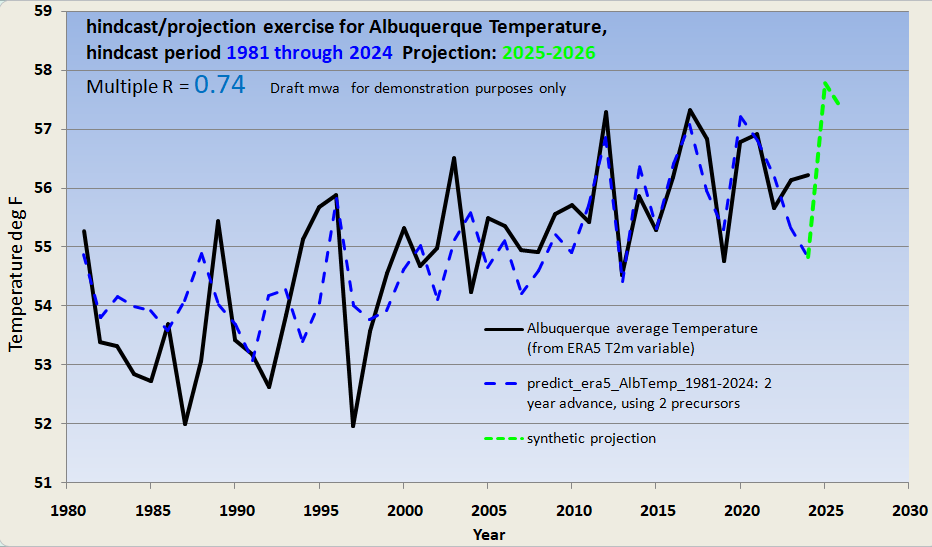
News March 2025: prototypes developed for 2-year advance annual forecasts of snowpack, temperature, river flow, and winds in Western US. Example for Albuquerque temperature hindcast exercise follows. Skill as measured by correlation R is 0.74. Forecast subscription can be purchased for two- to four- year projections, of any qualifying location and for any relevant variable in bullet list below. Some products may be available at seasonal and/or monthly scales. Climatologies are always included.
Contact MWA for additional information.
Update February 2025.
For a decade, MWA has pioneered solar forcing – based projections of river flows and of ENSO itself [1]. Over the past several years MW&A has developed new assets and processes which can now be used in many locations for diagnosis and the advance multi-year projection of climatic parameters including
- Surface Temperature
- Atmospheric Moisture
- Cloud Cover
- River Flows
- Droughts
- Wind Resources
- Ozone atmospheric background concentrations
- CO2 atmospheric background concentrations
- Ocean temperatures at any depth or location
- Ocean current components at any depth or location
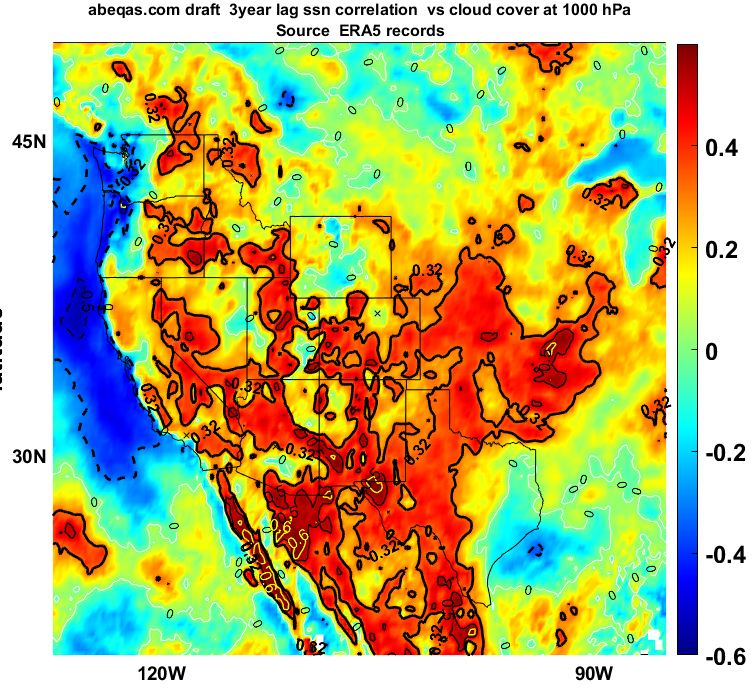
Examples of solar correlation to cloud cover across the Western US. A zero year lag shows little correlation, but a 3 year lag demonstrates significant correlations. 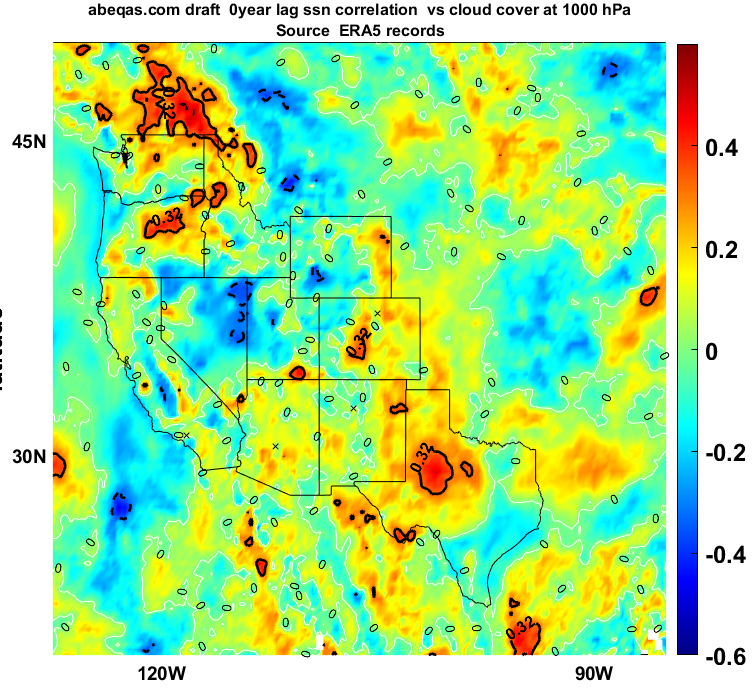
These multiyear falsifiable climate projection assets are designed to add crucial intelligence for planning in
- renewable energy business research and planning
- insurance
- agriculture & ranching
- mining & forestry
- aquaculture
- irrigation
- flood control and drought planning
- Ozone regulatory compliance
- CO2 accounting
Some material featured in September 2024 invited presentation to NASA JPL in Pasadena, CA [2].
Contact MWA for additional information.
MWA pioneered solar forcing – based projections of river flows and of ENSO itself. [1]
Completed results of several forecasts profiled in Wallace, 2019, Hydrological Sciences Journal [1], are compared to the resulting observations. First, here is the graphic result of observations versus projections for the Pecos River, near Pecos, NM. A follow up from this was used to provide an accurate multiyear forecast for the Santa Fe River, for a utility client.
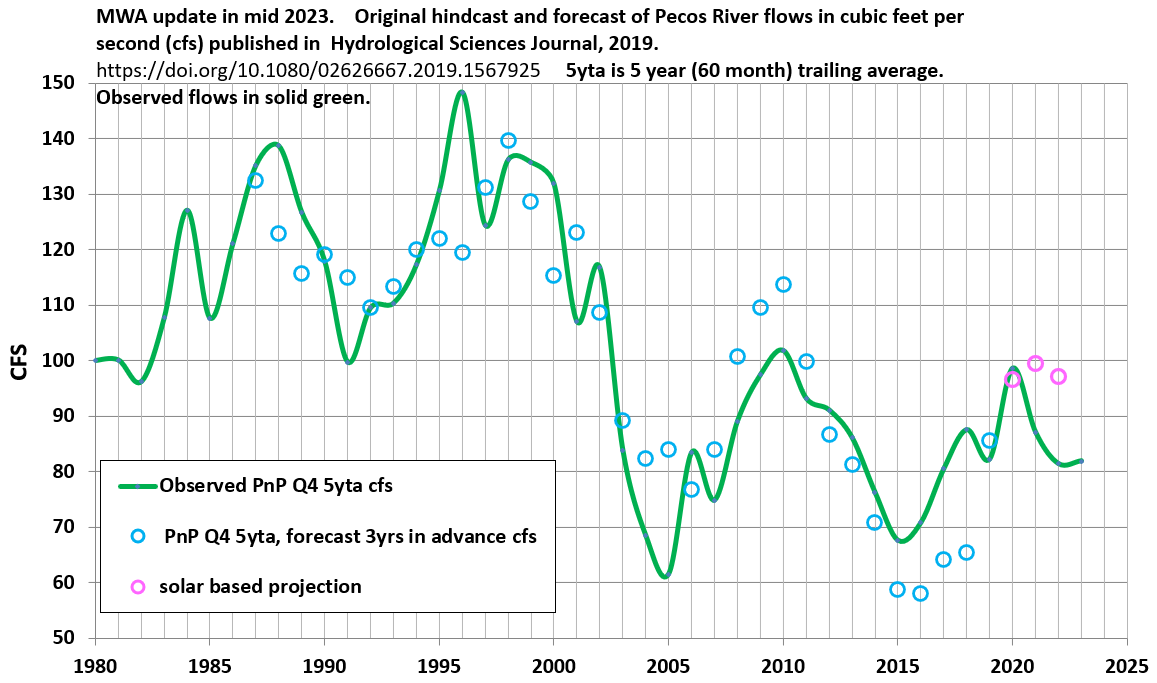
Unlike conventional parametric products or projections based on uncalibrated global circulation models (GCMs) and Exascale variants, our forecasts derive from long term lagged correlations between precursors identified through internal and external research. These are accordingly Cross Regression Moving Average (CRMA) exercises. In the examples below, a training period is utilized to show the ability of the method from an early time through to the end of the year 2016. The actual prediction period (the test period) follows from that point on.
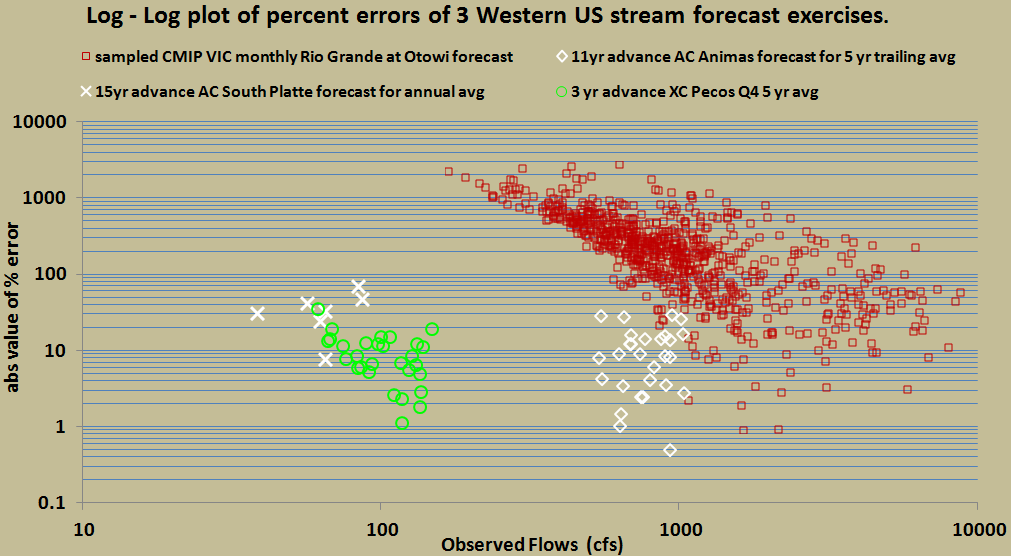
Comparison of accuracy of MWA hydrologic forecasts to those from climate models
The following chart shows a summary of the accuracy performance of all of MW&A streamflow forecasts posted at this site since the end of 2015, and compares those to the accuracy of predictions by the West-Wide Climate Assessment [3] (red points) for a stream in the same region. This chart demonstrates that MWA’s forecasts are significantly more accurate than the ruling emissions-based climate change paradigm. A more comprehensive description of this comparison is available at this update.
Special Profiles
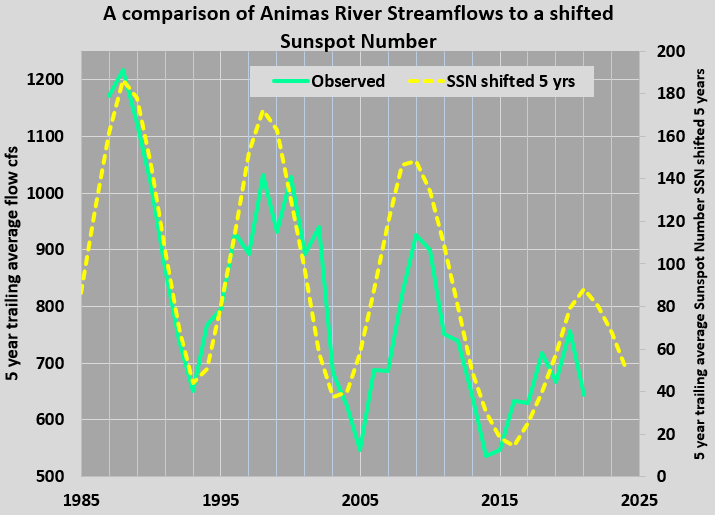
The Animas River cat 1:
I have made a forecast for flows in the Animas River as well. The format and scale are similar to my Pecos forecasts. Both have been featured in [1].
References
[1] Wallace, M.G., 2019, Application of lagged correlations between solar cycles and hydrosphere components towards sub-decadal forecasts of streamflows in the Western US. Hydrological Sciences Journal, Oxford UK Volume 64 Issue 2. doi: 10.1080/02626667.2019.
[2] Wallace, M.G., 2024 Invited presentation to NASA JPL AIRS SOUNDER meeting
[3] Variable Infiltration Capacity (VIC) model, numerous citations available