The accepted model of Atmospheric Ozone is a very leaky theory. Almost everything we learned about ozone is open to challenge. And many clearly important concerns are never openly discussed. I’m focusing on some of those issues lately and have left the most popular Antarctic Ozone Hole discussion to past posts. The verifiable cycle of ozone has been captured in incredible detail through 40 years of continuous satellite reanalysis coverage, including through the widely respected operational system known as the ECMWF. The opening animation of this post is an example documenting the 12 months of 1979 across the planet within the stratosphere at ECMWF model layer #13. I’m using the natural logarithm of air parcel mass fraction of ozone to squeeze all of that variability into a few frames.
As far as I know, this resource is typically never cited to indicate anything popular about ozone. I’m glad it is there and accessible. Perhaps the ECMWF will add full atmospheric (as much as possible) CO2 data someday, but in the meantime consider the ozone content I’ve extracted from the ECMWF for this post, including the featured 12 months (1979) animation of ozone in the stratosphere above, along with the table of four images below. The stratospheric ozone graphs for January and July of 1979 are at left, and the surface ozone maps for the same months are at right. You may be able to verify through simple visual cues that:
- Surface ozone across the host hemisphere for the overlying stratospheric ring of high Ozone is also relatively high.
- other interesting things
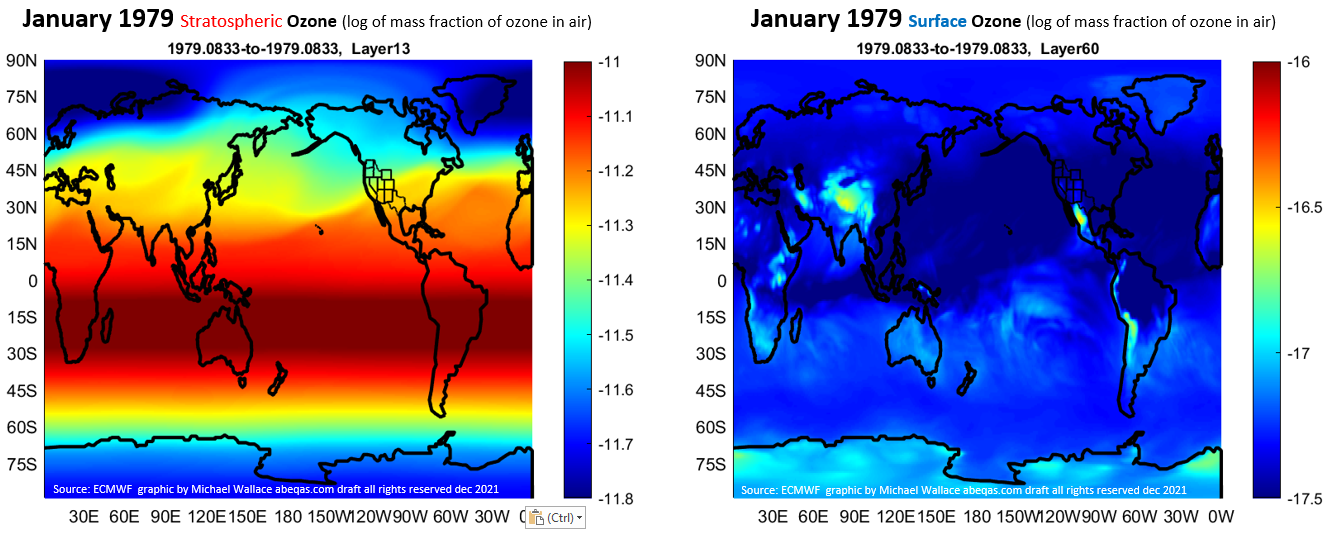
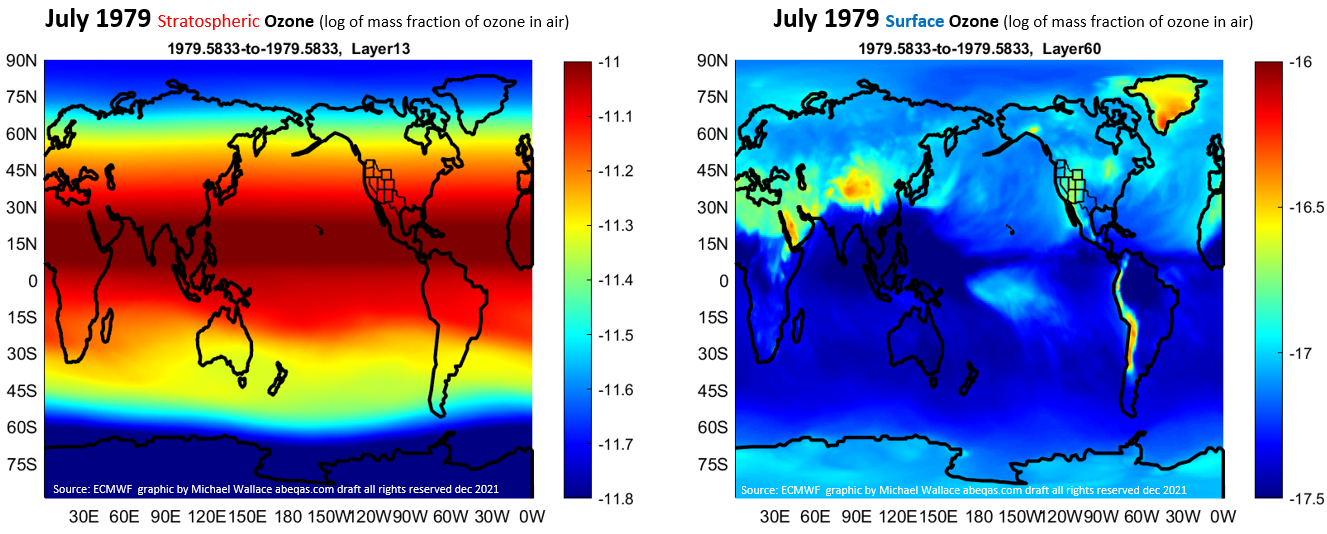
The frames corroborate at least that stratospheric ozone tracks to the Sun. This is again seen by the shifting and almost perfectly straight band of high ozone concentration in dark red. In a few data images and text this post already appears to indicate a controversial notion that the world’s surface ozone tracks closely to the world’s stratospheric ozone, which itself tracks closely to the Sun. This also suggests that the ozone layer as a UV screen is a bit leaky. The Ozone molecules are much heavier than air, and accordingly, they have a sinking tendency. Leaking of ozone seems to explain some the subdued trailing at the surface.
In contrast, the mainstream narrative claims that the two atmospheric layers are uniquely separated. An example follows through this NGO climate graphic (Source: Climate Change is Threatening Air Quality across the Country | Climate Central):
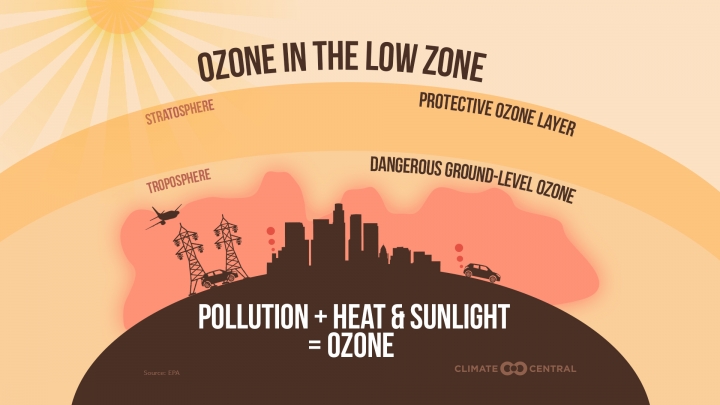
The top zone has been designated as the region where abundant ozone shields us from Solar UV rays. The bottom zone has been designated as the region where pollution alone triggers ozone. The official narrative, reinforced by the Montreal Protocol, claims that within the stratosphere, ozone that is created by the Sun is exclusively destroyed by manmade refrigerants known as chlorofluorocarbons (CFCs) and related industrial chemicals. I’ve also read less NGO tinged air quality work that seems more aware but perhaps not as practical as possible. The mainstream narrative presents a notion of a uniform, normally unchanging stratospheric ozone blanket that has been uniquely threatened somehow by heavy manmade molecules.
In contrast, the ECMWF data again supports that atmospheric moisture has an overall negative influence on the richness of ozone in our atmosphere. Here is a related set of frames, where I’ve added moisture, as Specific Humidity (SH) on the left for the same July month:
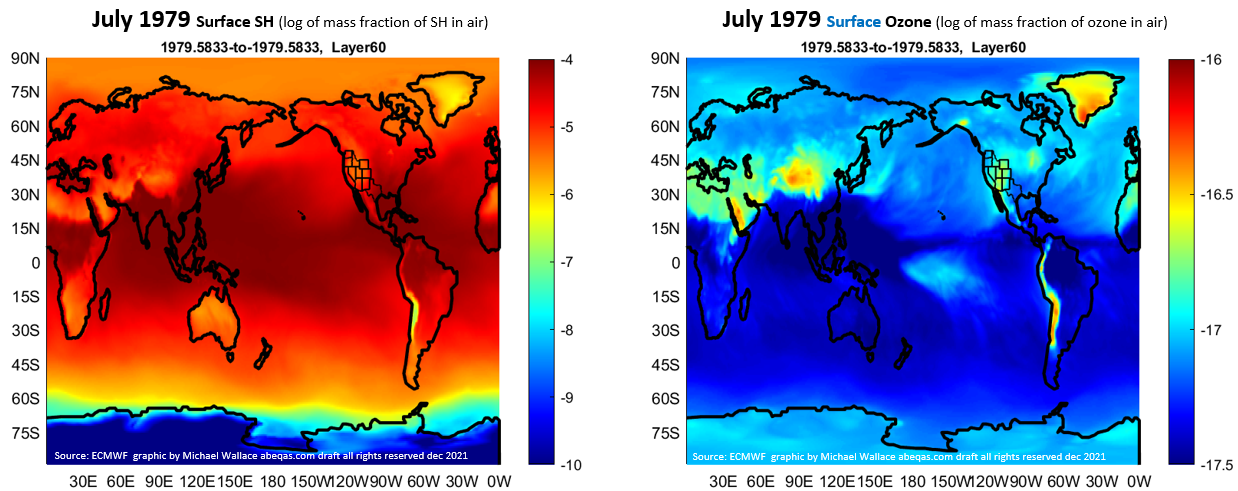
Moisture’s inverse trend to Ozone is seen by the sharp boundary between the Himalyas and the rest of India, or the separation shown between equatorial Africa and the drier regions to the north and south for example. This is true even for the surface of Antarctica, when it is facing away from the Sun in July. Also the highest surface ozone levels identifiable by satellite reanalyses are typically not correlated to urban areas or other sources such as oil and gas wells.
One reason for high ozone surface official reports is because of the proximity of the monitoring instrument to the industrial and related ozone sources. The US EPA for example, monitors ozone at a few land stations, situated where localized ozone is often expected to be highest. That’s certainly understandable. I’d be the last to argue against the claim that auto and factory and oil field emissions produced volatile compounds that react with sunlight to produce ozone. And I recognize that ozone is not healthy to breathe in any large concentration, and yet breathing some ozone is unavoidable, if only because some concentration of ozone is always in our atmosphere. You can never entirely eliminate ozone from the air you breathe, no matter who claims to regulate the atmosphere.
Background ozone may be collected from background stations, but do they match the ozone maps above? Here’s a rough comparison starting with EPA’s NM ozone readings in ppm:
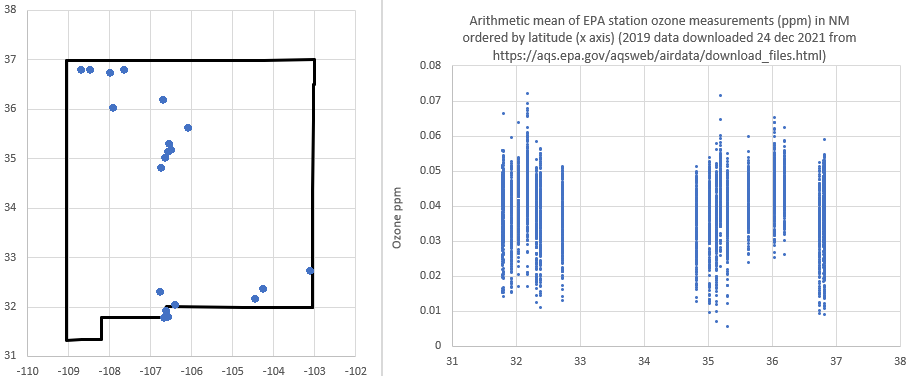
Notably, the cutoff for acceptable ozone is roughly at 70 ppb. This is breached twice in the chart at right, once for the southern cluster and once for the middle region of the state. In contrast, here I have mapped surface ozone across New Mexico and adjoining regions over December of 2018, in units of the log of mass fraction times 10-8, which equates to ppb:
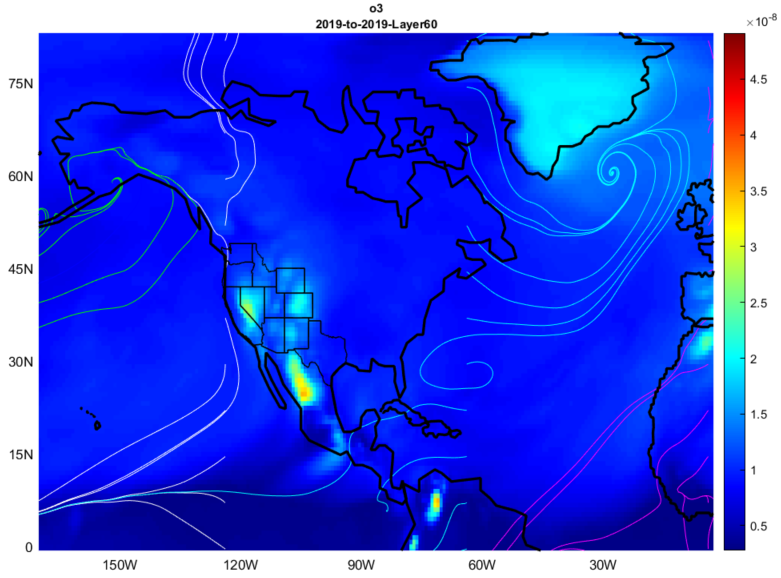
The satellite surface ozone patterns do appear to inversely align, again, to atmospheric moisture. For example, the ozone concentrations drop to almost zero across the very wet Equatorial regions below 15N. Moreover, the concentrations seem in the same ballpark as the EPA example over New Mexico. (sorry for previous versions of this post, where I forgot to correct for log10 vs natural logarithms). But as seen, the highest ozone concentrations as observed by satellites, don’t correspond to locations of urban density. Nor do they correlate to high oil and gas production regions such as SE New Mexico or West Texas.
Also, winds across the SW US for this month are relatively low, so the high ozone patches either leaked from the stratosphere above, or emerged from volatiles at the surface that were exposed to the Sun.
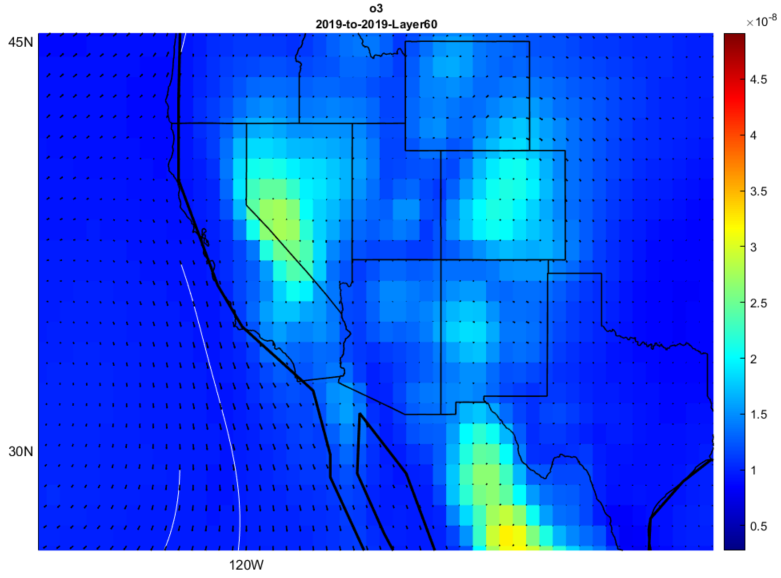
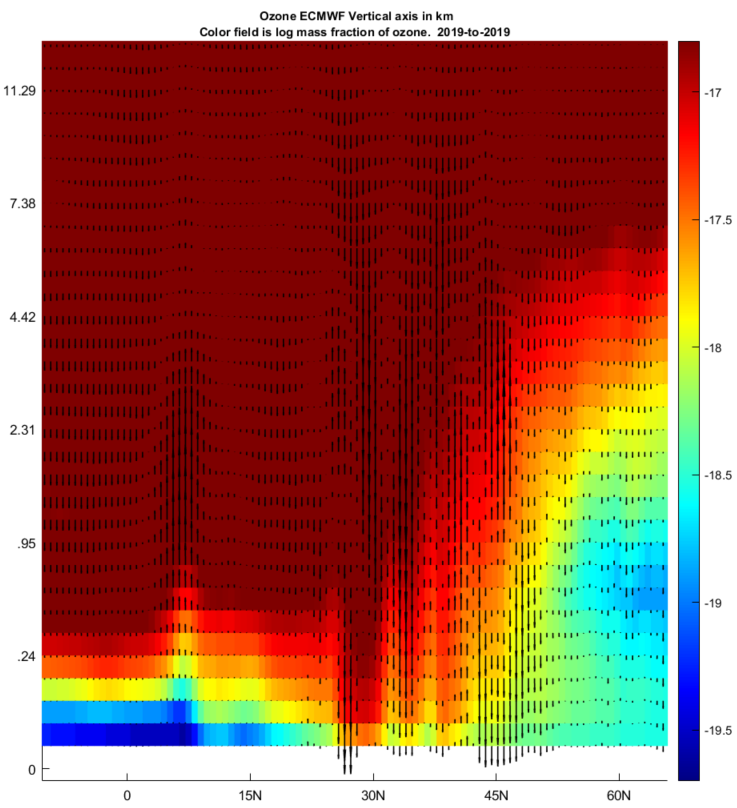
Do either the surface VOCs or the stratospheric leaking of ozone, or both account for these maps? Or do those high ozone patches originate from major cities and oil and gas fields? Or do the non-volatile anthropogenic CFCs still somehow troll around our atmosphere, deliberately destroying surface ozone wherever encountered? I think I’m going to go with stratospheric leaking once again. That’s because of this vertical cross section of the same ozone data set for the same month, to align to 107W Longitude, roughly crossing Albuquerque in Central NM a few degrees north of 30N.
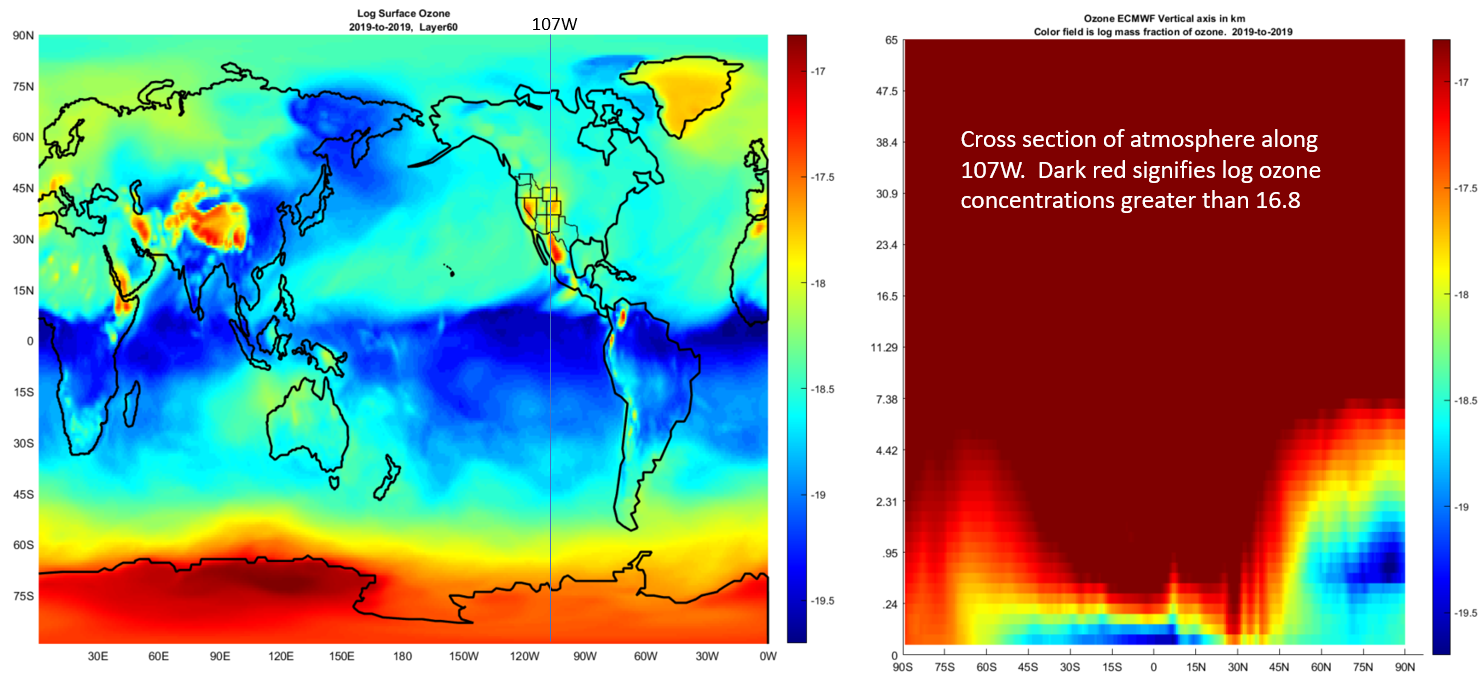
The color scales are the same, and so this is an apples to apples comparison of ozone. Feel free to cross check, but the high surface ozone patches in Mexico and the southwestern US appear to be entirely from leakage of ozone from the stratosphere. Perhaps better to call it ozone-pouring as the velocity vectors of this close up appear to support.
These patches of higher ozone across western North America, are impressively persistent or stationary, even as the overall trends of ozone shift continuously.
The simple goal of protecting us from too much ozone where we live and breathe is understandable. The expanded goal of protecting us from too much climate, by regulating ozone even more, might not add up. And since ozone can be parsed down to parts per trillion, any climate-change inspired regulations might not stop until we are all completely asphyxiated. Here’s a very recent example of this kind of activist thinking on ozone regulations over the same region that I’ve just profiled. That Phys.org article urgers further ozone regulatory tightening but only fingers human causes and climate change. There is no mention of the pouring of ozone down to the surface from the stratosphere.
Ozone and the other misunderstood Gas
The holes in the Ozone Theory relate to both what is happening in our atmosphere, around our planet, and why. I’ve been working on a series of pairs of hemispherical images for my continued study of ozone, specific humidity and winds and more. This one below is perhaps among the most visually interesting.
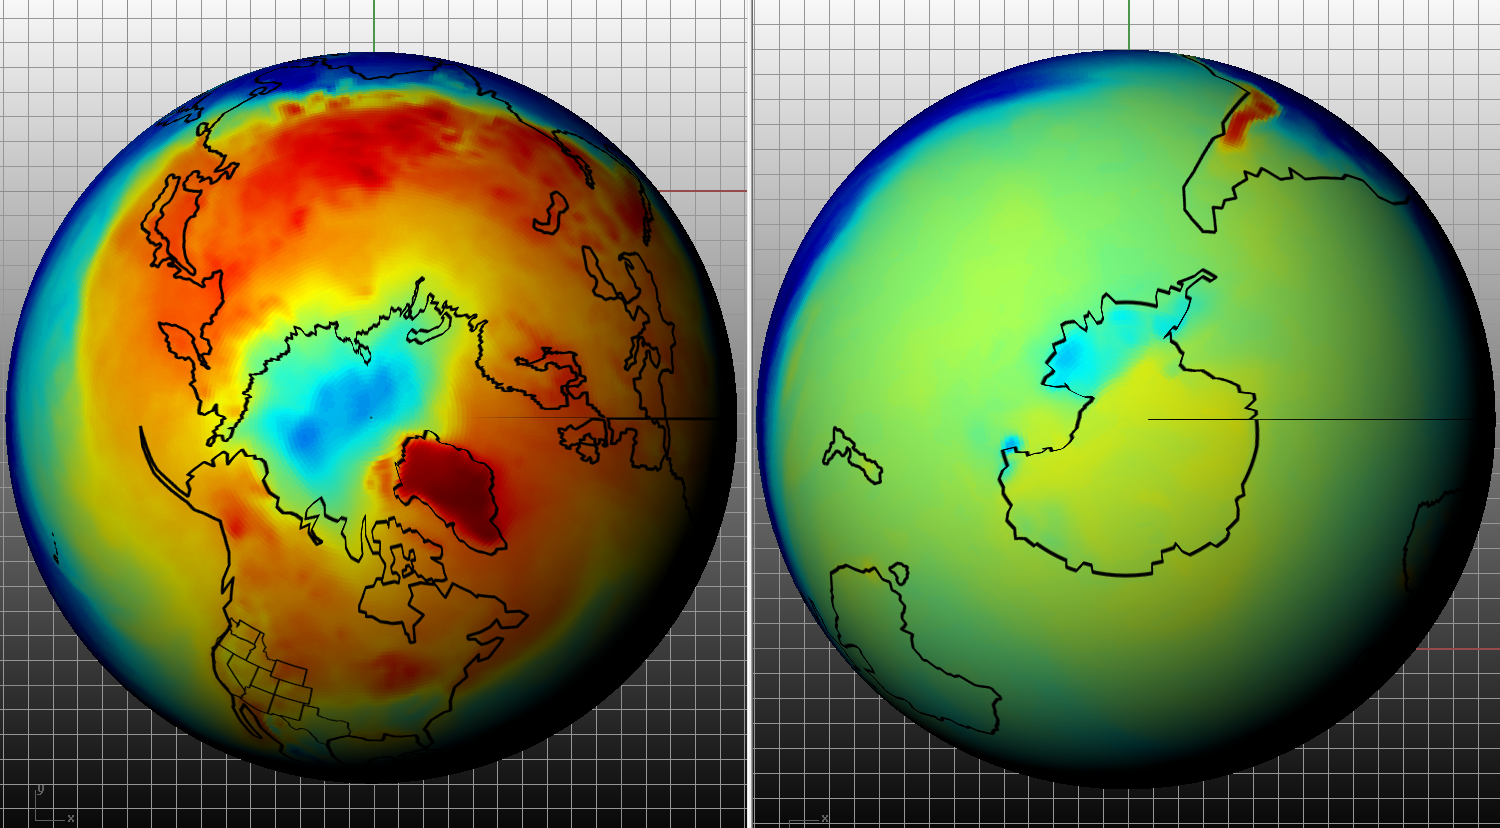
If you read posts here, you might recognize the interesting connections between the left image above and this next table which covers concentrations of that other misunderstood gas, CO2. Especially perhaps over Greenland. The above left image covers May for one year, so for apples to apples, you can compare to the May CO2 image below.
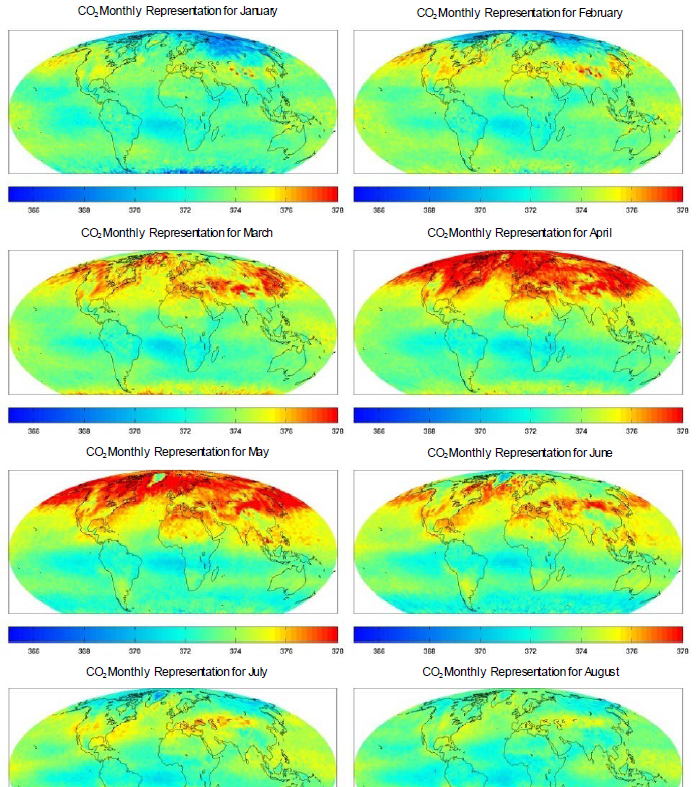
The reasons for the patterns of both Ozone and CO2 across Greenland in our atmosphere might be quite natural, and I’m certainly hopeful to publish in that direction. April and May CO2 concentrations are by far, the highest. And the scale of CO2 shown is comparable to the reports of atmospheric CO2 over the globe at that time. If the CO2 high points are seasonal, but industry high points are not, then it might be misguided to attribute industry as the major cause. Unlike the continuous ozone coverage however, this satellite CO2 data has not been publicly clarified or updated.
Where is the Evidence that SOLAR UV-B is BLOCKED by the Ozone Layer?
Ozone may not actually be an effective shield against Solar UV, and if that were true, it would be another missing leg from the Ozone Theory. It seems reasonable to believe that UV helps create Ozone, but there don’t appear to be any papers that show a sharp drop in UV below the stratosphere, where all of that Ozone mostly resides. I’ve started to study the peer reviewed literature, including this paper on UV actinic flux over a mountainous region, and one that maps Solar UV-A, B, and C climatologically, and another paper that one would expect to show this sharp drop through a masssive synoptic investigation:
The work appears to have ignored natural ozone sloshing:
Through this seasonal animation based on the ECMWF data, you can confirm that Ozone is likely always low over the Northern Hemisphere including the Arctic every Winter. Rather the synoptic international multi modal exercise attributed those patterns to chlorine. And although the paper suggests that UV was monitored, again, I couldn’t find any UV inflection profile there. So returning to this UV subsection, it may only be the optical thickness of the atmosphere that affords any UV-B protection.
The spectrum of radiation is continuous, and not easily binned into A,B, and C cubby holes. With that in mind, the shorter wavelength, higher energy radiation bins (C and B) don’t reach as far down through the atmosphere to the Earth’s surface, as the longer wavelengths do (A and then visible light). I haven’t yet located any literature which indicates an inflection (a sharp drop in intensity) of the UV-B rays across the Ozone Layer. Without any evidence of such an inflection, the claim that the Ozone Layer Blocks Solar UV-B doesn’t seem to be justified.
Draft and contains opinions. All rights reserved.