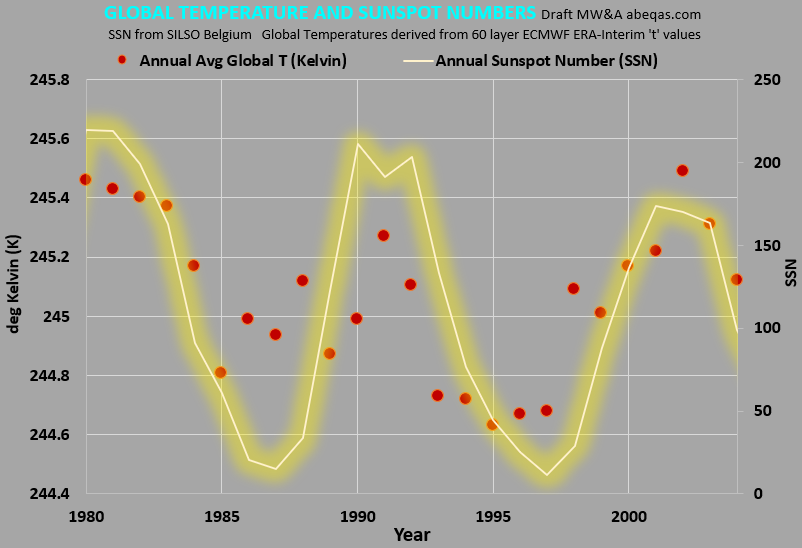
It seems apparent, at least from one profile exercise through the Earth’s atmosphere, that sunspot numbers express a statistically significant correlation to temperatures. The featured image demonstrates this and includes the minimal sourcing information needed by any to corroborate.
The ERA-Interim series remains to me much like a high-performance engine, which has served thousands of working meteorologists well for decades. As many posts featured here demonstrate, it continues to yield rich information for those who take the time and care to explore it.
So far as my limited exploration has gone, only this profile of the ECMWF ‘t’ parameter expresses such a graphically evident correlation to solar forcing. I arrived at this series by averaging annual temperatures at all 60 layers, 480 longitude strips, and 241 latitude strips provided from this source, over a longer period of time than shown.
Although the correlation is statistically significant for the full time series available, I did crop out the image to highlight the best span for viewing. I’m only making a point, but it seems to be a great one if I’m not mistaken. Satellite temperature time series have been forced to a back seat, so please welcome the open exploration of satellite temperature information, by any interested party.
This blog includes many posts which compare satellite temperature data to numerous climatological topics. It’s been interesting to learn/interpret from some satellite reanalysis data that:
- Most of the planet is not warming
- Antarctica has been cooling for decades
- Middle latitudes of the planet have been stable for decades
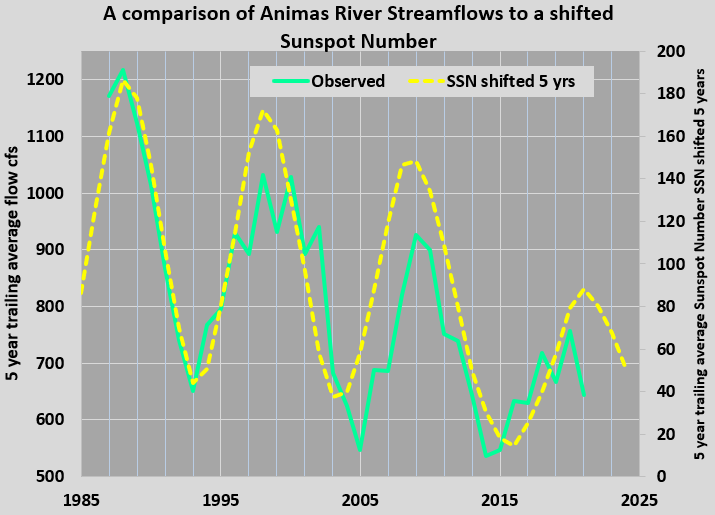
As interesting and important as those observations might be, they only seem to support notions in global hydrology [1] I explored which pointed to statistically significant lagged connections between 60 month averages of solar cycles and surface stream flows, at least across high altitude mountain catchments.
This is only a blog and my learning curve remains steep. In the making of the top image, I was interested in probing through every single cell of altitude, latitude and longitude, more for looking at ozone and specific humidity, such as featured at this earlier post. Temperature was an afterthought, but very convenient to add to the examination I was conducting.
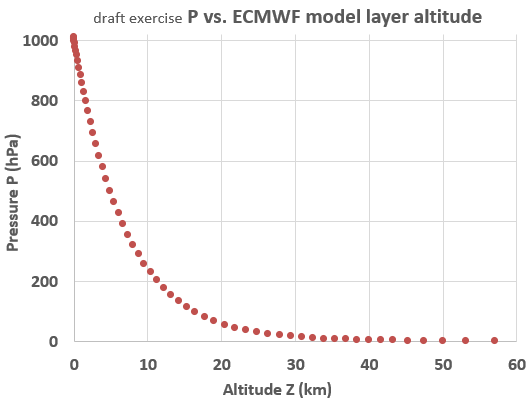
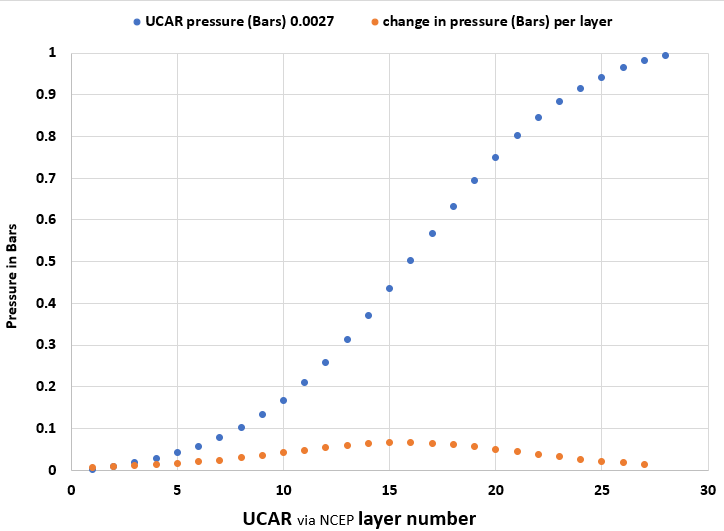
For what it may be worth, the 60 layer ECMWF ERA-Interim series weights the parametric layer divisions. Because the bulk of the atmospheric mass is found within the first 10 to 15 km of altitude, the bulk of layers (about 30 of the 60 total) are found there as well. I’ve developed a rough chart comparing each layer’s nominal elevation and pressure, based on Table 2 of “The ERA-Interim archive Version 2.0“
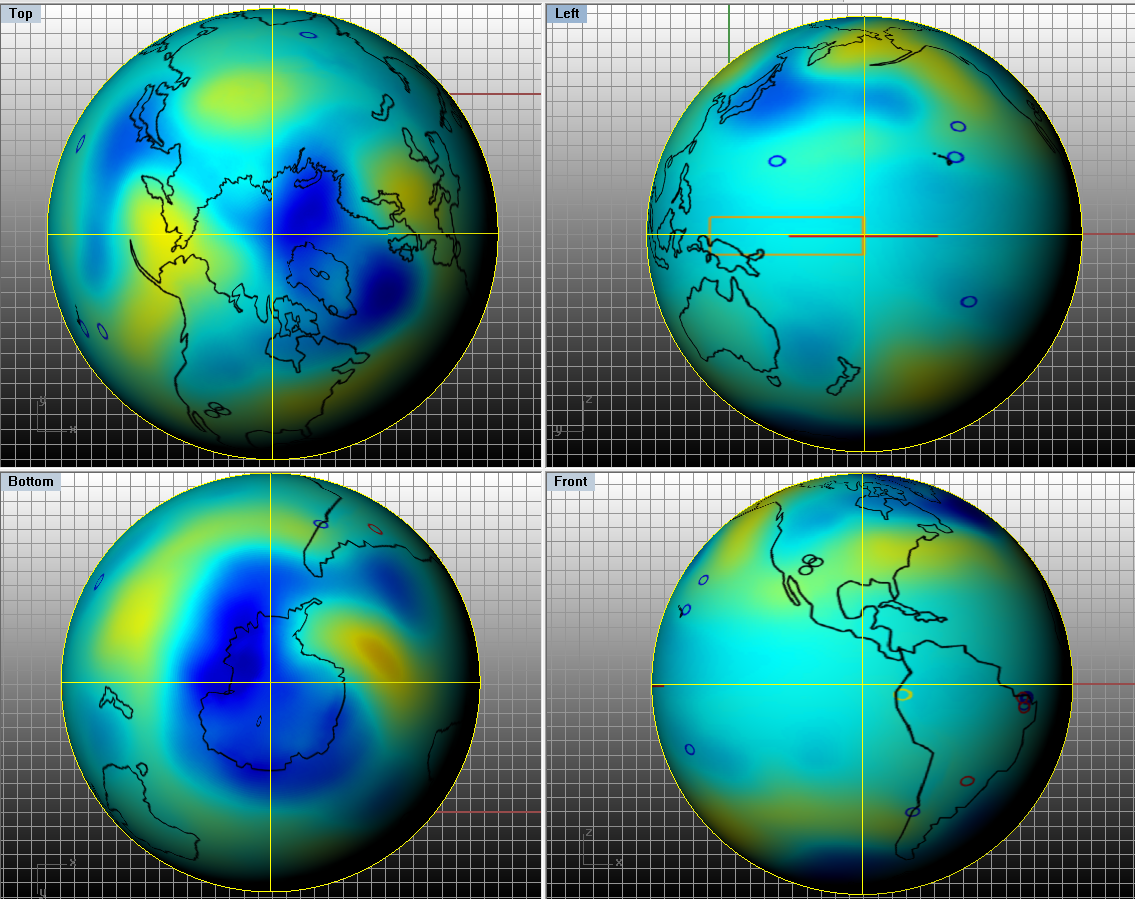
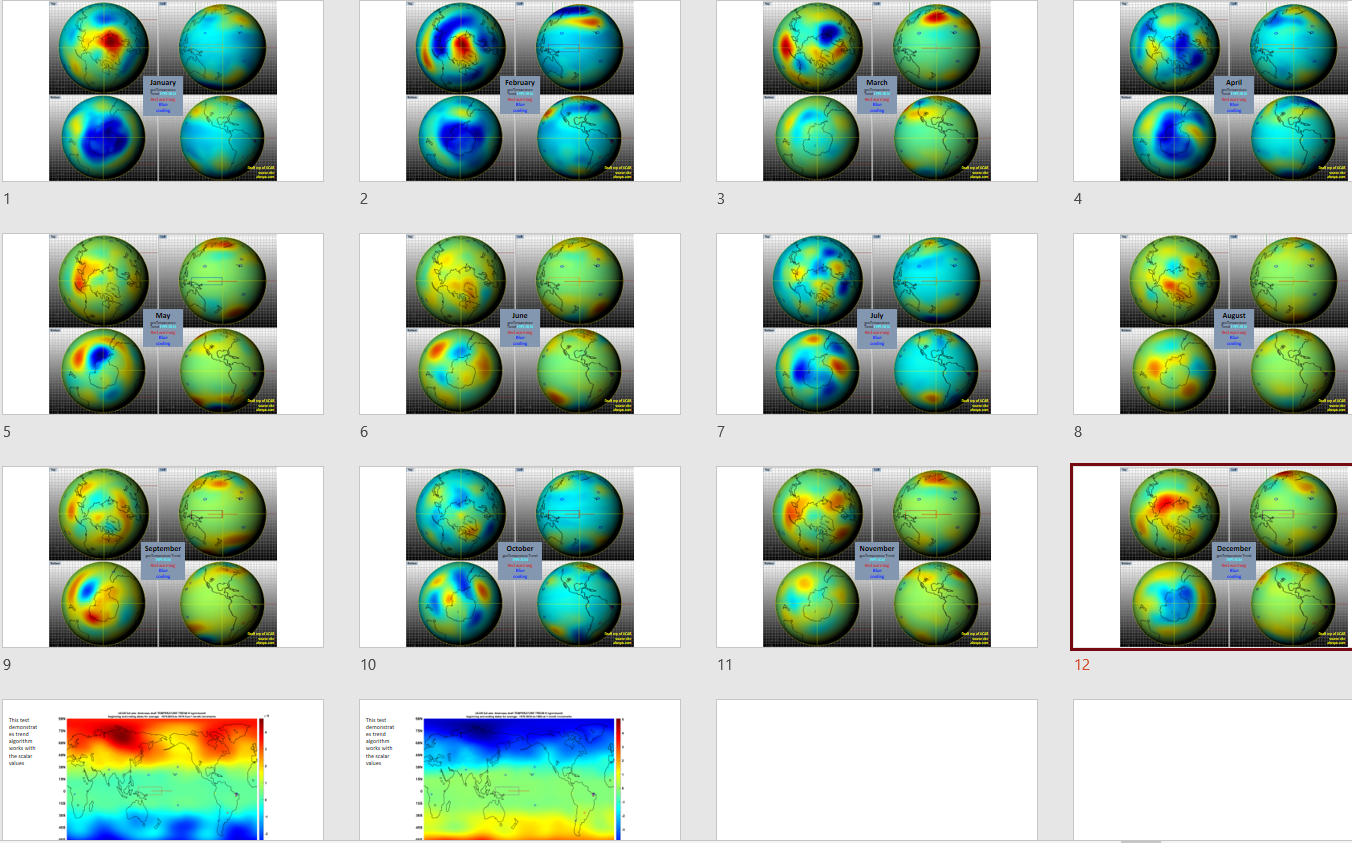
I am familiar with another, related satellite resource called UCAR. Here are temperature trends of interest. The deeper the red, the more that month has warmed, for that region, from 1979 through 2014. The deeper the blue, the more it has cooled. The other two quarter months, July and October are not nearly as interesting but I do included those in a final image map towards the end of this post. This direction of the post is a bit of detour. But it suggests that Winters across the Arctic have warmed while Springs across the Arctic have cooled. Meanwhile, the Antarctic appears to be cooling over both of those months.
I have explored a paper [2] which noted this Spring Arctic cooling, but it only addressed the stratosphere. I think the paper might have supported a broader interpretation, extending down to the surface of the Arctic. In my view and that of some earlier researchers, ozone concentrations are driven by solar cycles. This post points to evidence that temperatures are as well. The two parameters may be simply covariates that are not otherwise directly related. This would be interesting for wider discussions as well. The paper and many papers since, relies on models to propose feedbacks between ozone and temperature of the stratosphere. Yet they will need to include an ozone model for the lower atmosphere, and for the upper; solar forcing. I propose that these image maps of temperature trends are worth the attempts of models to someday reproduce. They are also partially verified by the final screen captures.
This post will now capture some relevant updates within May 2022
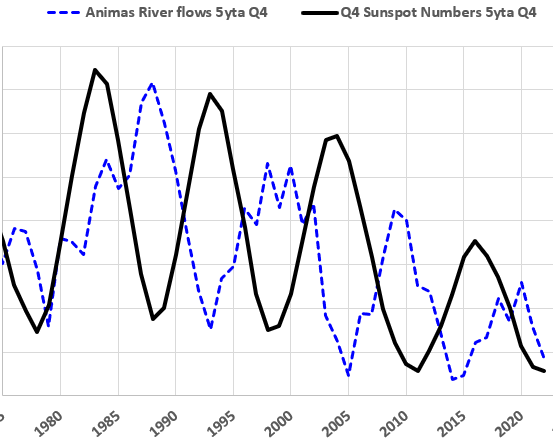
I’ve worked to update some information from SILSO and the USGS records of Animas River at Farmington, New Mexico. Here is an informal update of both observation record sets, without any shifting.
After other updates, I’ll return to routing forecast comparisons.
[2] Randel, William J., and Fei Wu. “Cooling of the Arctic and Antarctic polar stratospheres due to ozone depletion.” Journal of Climate 12, no. 5 (1999): 1467-1479.