Immunofluorescence and Climate Change
Update Feb 2024: This page conveniently covers some common aspects of pandemic and climate concerns.
Original post follows
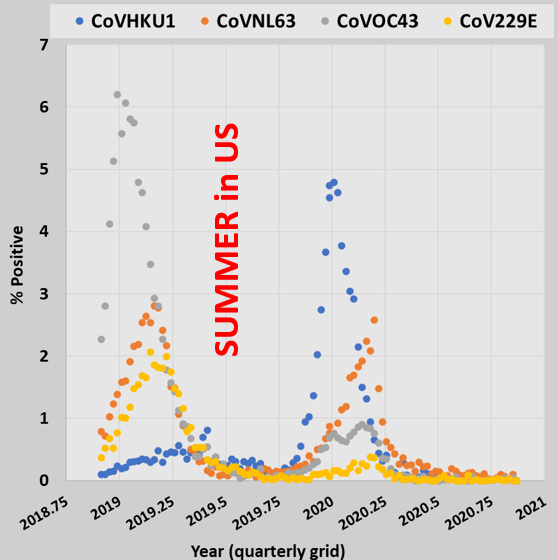
There are multiple connections between these terms. In the featured image adapted from [1], four separate lineages/strains of Coronavirus are shown to be seasonal. Prior to the suspension of normal respiratory virus surveillance, the strains were routinely identified through immunofluorescence. In other words, small laboratory mammals were exposed to viral antigens, which triggered antibody production. The antibodies were harvested and included in immunoflourescing assay kits. Then nasal discharge samples from sick humans were added to the cultures. Depending on the fluorescent signature if any, health worker bees could usually identify at least the four major strains of coronavirus.
A paper I coauthored explores threads of climate and coronaviruses along these and related themes. But it also noted that the CDC pipeline for reporting results from these tests was suspended. I later began to confirm that the animal challenge studies were not included in Covid-19 vaccine efficacy studies. I’ve cited two studies so far and feel free to review related posts to corroborate.
I’ll continue to chronicle the low key but still very incomplete and unsatisfactory return of antigenic testing to viral surveillance and vaccine efficacy studies. I’m currently exploring a new study by Yamasoba et al., where the Omicron variants are antigenically studied in comparison to Covid-19 and the Delta variant. That accordingly means that immunofluorescence was studied:
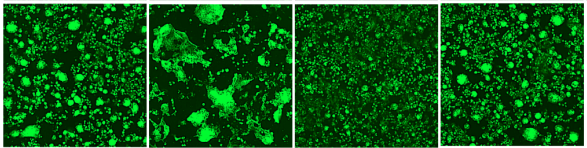
I’m only an earth scientist who is interested in viral circulation around the planet. But in any case, the flourescent part of their work seems to be critical once again. Here is another excerpt from the same study:
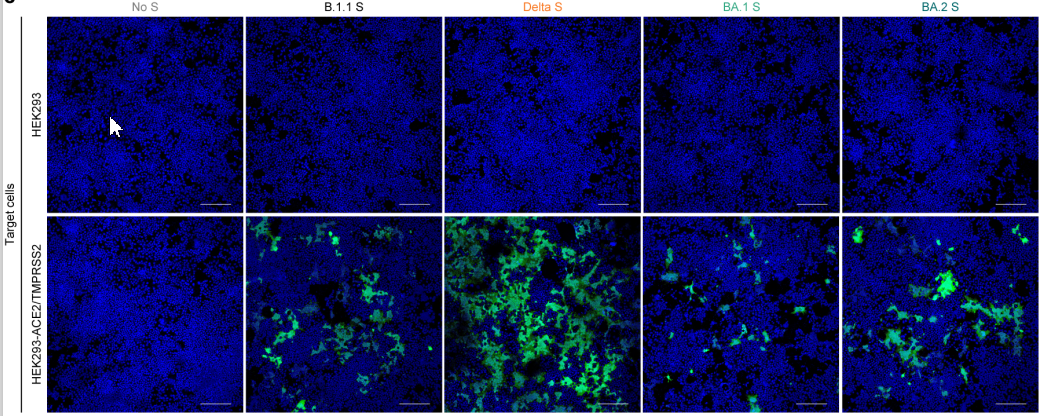
Notably, the intersections of the animal antibodies with each of the alleged mutations of the virus are glowing (they demonstrate flourescence). Prior to the pandemic, the CDC’s RSR ensured that when an immunofluorescent reaction was clear for all cases, all of these variants were lumped into a single antigenic category. That’s parsimony, which is great for taxpayers and public health. To ensure that the handful of major respiratory virus categories remain mutually exclusive, the tests above should now include recognized coronavirus variants of the common cold: CoVHKU1, CoVNL63, CoVOC43, and CoV229E.
Again, because Covid-19 (B.1.1) and its progeny all flouresce in the featured test, then they all belong to the same antigenic category. And because the researchers did not publish comparisons to other strains (even to influenza strains), confirmation has still not emerged for assertions that the pandemic was associated with a unique superbug.
Because I’ve often brought this up, I’m also reading articles about immunofluorescence tests for CoVHKU1, CoVNL63, CoVOC43, and CoV229E. This article, Human Coronavirus-229E, -OC43, -NL63, and -HKU1 (Coronaviridae), indicates that they can be tested in this way. So if one is diagnosed by one test for the pandemic virus, they might take the initiative to supply another nasal sample for the associated immunofluoroassay tests of these common cold viruses. Oddly the study although informative, appears to steer widely around the superbug question.
Fluorescence intersects many other aspects of hydroclimatology. For example, the actual fluorescence process above is directly tied to pH changes in the aqueous world of proteins. Another, perhaps more interesting connection of fluorescence to climate change relates to the same phenomenon that the greenhouse gas theory aspires to. The greenhouse gas effect and the fluorescent effect are quantum and not kinetic. By definition, quantum scale phenomena treat kinetic scaled processes as if they were standing still. Gas molecules can move at over 500 meters per second, but in the quantum perspective, they are relative statues.
Both the notion of greenhouse gases, and the fact of fluorescence, are attributed to represent the absorption of energy at relatively short wavelengths, and the emission of an equivalent amount of energy at relatively longer wavelengths. Here’s a classic description of an ideal absorption and fluorescence pair:
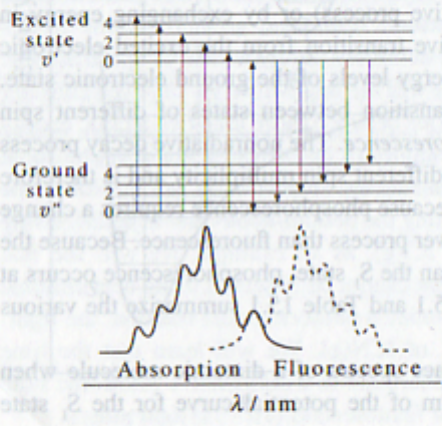
In the greenhouse gas equivalent, one would expect that something similar could be visualized. So far in literature, one typically only sees evidence of IR absorption. In other words, CO2 seems to be just another everyday IR-active molecule. If it doesn’t emit what is absorbed, then Beer-Lambert extinction seems to naturally apply, as it does to all kinds of energy.
In any case, temperature for humans IS kinetic energy. It is the cause of the warmth you feel for example, when air molecules bounce more furiously in the atmospheric soup. The molecules virtually push and scrape against your skin. If their kinetics are higher or lower, you’ll feel warmer or colder respectively. Or for a thermometer, the glass tube will heat up or cool down as well from the same air molecular onslaught, conducting the heat to the mercury, which expands or contracts accordingly. So the kinetic theory of gases relates that the greater the pressure, the greater the jostling of gas molecules. The greater their jostling, the higher the temperature.
In justifying the CO2 greenhouse gas effect, earlier reseachers appear to have neglected Venus’s atmospheric pressures. My thoughts often stray on this pressure temperature rail towards Venus and orphaned gas giants. That also reinforces that the higher the pressure, the warmer the temperature.
That wasn’t even a digression because CO2 does kinetically absorb and release heat, as captured by its measured specific heat, just like any other gas. For surface temperature and pressure ranges on Earth, that value for the primary greenhouse gas is actually lower than the specific heat for typical air mixtures.
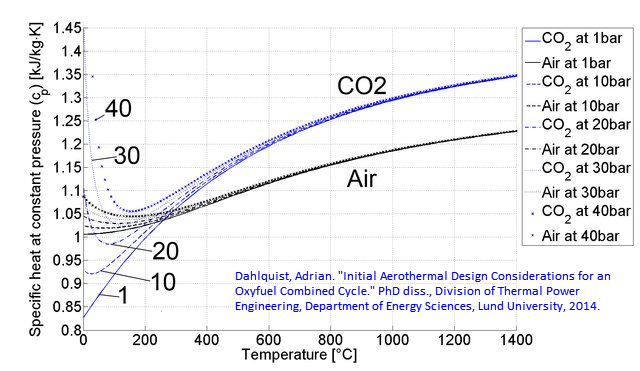
This means that CO2 concentrations and related jostling can’t significantly account for the storage or release of atmospheric heat. And their relative concentration in the atmosphere is vanishingly low. If specific heat is CO2’s only valid heat storage and release metric, then it cannot be credibly attributed as a player in the field of global warming or cooling. Under Earth’s atmospheric conditions of temperature and pressure, CO2 may qualify as the anti-greenhouse gas. There’s no cozy blanket from this source, whether emitted from a smokestack or from natural ocean upwelling.
The figure above also happens to demonstrate that with higher pressures, the specific heat of CO2 does surpass that of Earth’s dry air. Venus again comes to mind, reinforcing that the normal everyday specific heat of CO2 and other gases can account for temperatures more reproducibly than any climate change model.
Circling back slightly to the Earth itself as a type of luminous analogy to fluorescence:
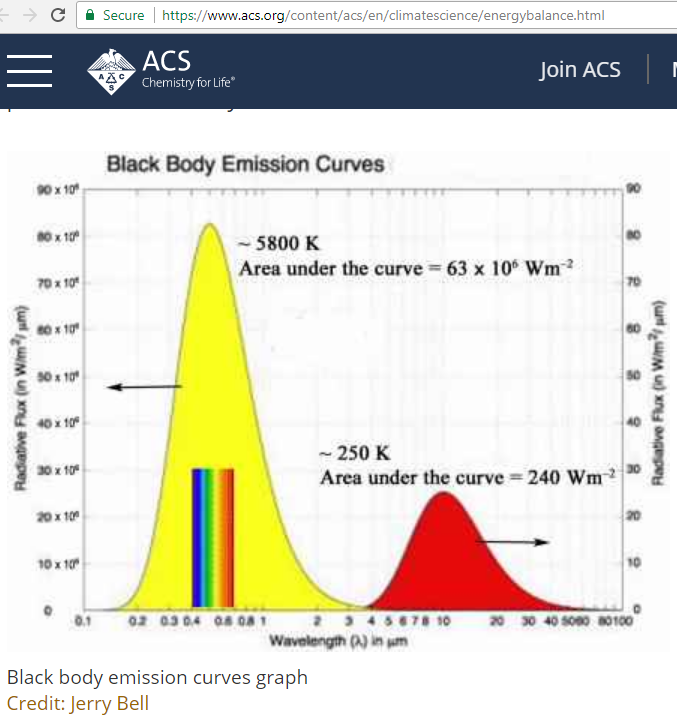
One can further analogize the entire planet as one “quantum dot“, which when exposed to solar radiation, displays luminescence of a sort by absorbing higher frequencies of energy, and emitting at lower frequencies. Again, there is no equivalent comparison time series (or other) charts available for both the absorption of energy by a CO2 molecule, coupled with the subsequent release of energy by the same molecule.
Given the quantum time scale context, this capture and release of photons by the IR active CO2 molecules are practically simultaneous. In other words, there is no real storage of energy going on in any time frame of relevance to us. Most fluorescence examples occur in seconds or less. Even the much more massive fluorescing proteins only remain fluorescent for a few hours at most. And when the gas is absorbing heat, the atmosphere becomes a little bit cooler, one would expect. Only when the gas releases its theoretical ghg heat is parity restored. And parity restoring only means that the atmospheric temperature was restored to what the theorists seem to believe it should have been in the first place.
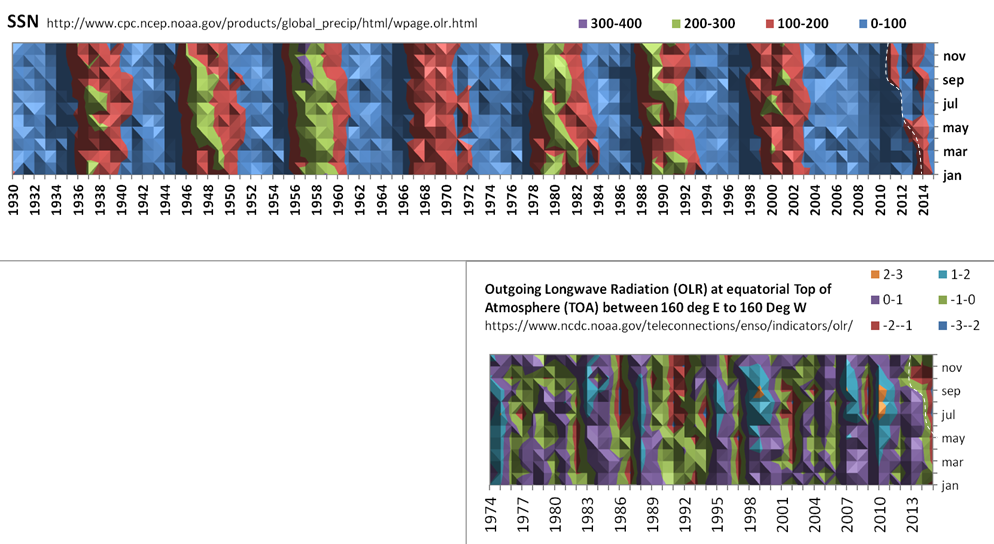
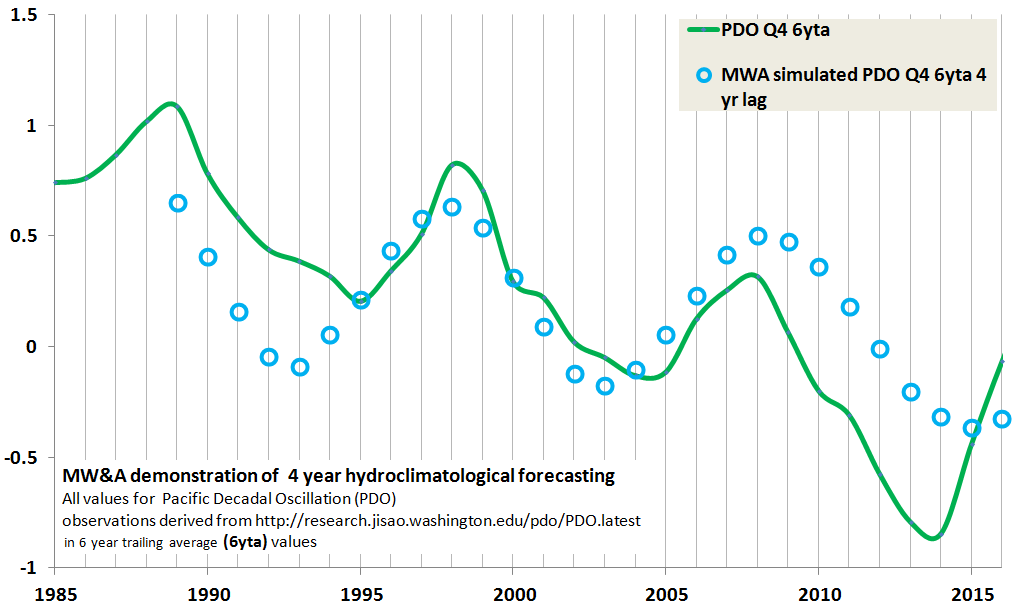
Fortunately for Earth, we can quantify the heat that is captured and released by the state changes of moisture. Those remain disregarded given current climate change promotions. The interesting thing about the related divergence of latent heat (LEDIV) patterns, is that over wide regions, they oscillate in tune with the Animas River in the Southern Rocky Mountains (which resonates with the Solar cycle frequency). They also express modal intensities of roughly (plus and minus) 240 Watts per meter squared (see below map and legend). That’s on par with the radiative magnitude of Solar Forcing. In plain language, the heat generated on our planet by solar radiation is significantly “captured” by evaporation from global water surfaces, and is significantly “released” by condensation of global moisture (producing rain and snow).
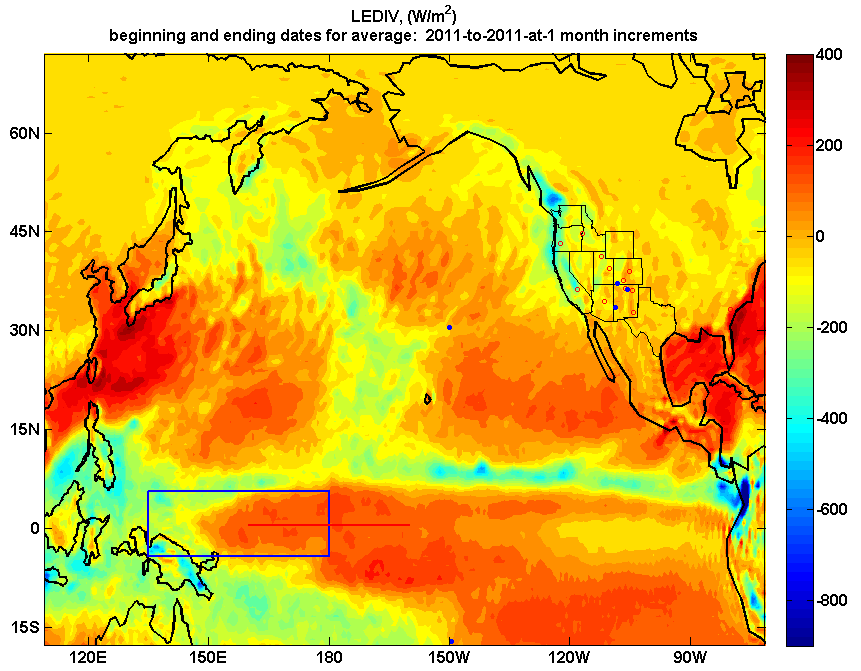
This heat is largely stored in the water under a vapor state and released upon condensation. The intervening time is not completely known or understood, but is expected to range from days to months. Yet the state changes of moisture, captured by LEDIV, are not in tune or on par with CO2 patterns. Not even a tiny bit. You’d have to ask other climate or hydrology subject matter experts why they haven’t published their own paper to dispute my publication [3] which explores much about LEDIV, the Animas, and Solar cycles, in greater detail.
related older post: Assets for NANO CAFE presentation – MW&A (abeqas.com)
References:
[1] Wallace, M.G., Wang, Y. Pollen antigens and atmospheric circulation driven seasonal respiratory viral outbreak and its implication to the Covid-19 pandemic. Sci Rep 11, 16945 (2021). https://doi.org/10.1038/s41598-021-96282-y open access publication now available here.
[2] @article {Yamasoba2022.02.14.480335,
author = {Yamasoba, Daichi and Kimura, Izumi and Nasser, Hesham and Morioka, Yuhei and Nao, Naganori and Ito, Jumpei and Uriu, Keiya and Tsuda, Masumi and Zahradnik, Jiri and Shirakawa, Kotaro and Suzuki, Rigel and Kishimoto, Mai and Kosugi, Yusuke and Kobiyama, Kouji and Hara, Teppei and Toyoda, Mako and Tanaka, Yuri L and Butlertanaka, Erika P and Shimizu, Ryo and Ito, Hayato and Wang, Lei and Oda, Yoshitaka and Orba, Yasuko and Sasaki, Michihito and Nagata, Kayoko and Yoshimatsu, Kumiko and Asakura, Hiroyuki and Nagashima, Mami and Sadamasu, Kenji and Yoshimura, Kazuhisa and Kuramochi, Jin and Seki, Motoaki and Fujiki, Ryoji and Kaneda, Atsushi and Shimada, Tadanaga and Nakada, Taka-aki and Sakao, Seiichiro and Suzuki, Takuji and Ueno, Takamasa and Takaori-Kondo, Akifumi and Ishii, Ken J and Schreiber, Gideon and The Genotype to Phenotype Japan (G2P-Japan) Consortium and Sawa, Hirofumi and Saito, Akatsuki and Irie, Takashi and Tanaka, Shinya and Matsuno, Keita and Fukuhara, Takasuke and Ikeda, Terumasa and Sato, Kei}, title = {Virological characteristics of SARS-CoV-2 BA.2 variant}, elocation-id = {2022.02.14.480335}, year = {2022}, doi = {10.1101/2022.02.14.480335}, publisher = {Cold Spring Harbor Laboratory},
[3] Wallace, M.G., 2019, Application of lagged correlations between solar cycles and hydrosphere components towards sub-decadal forecasts of streamflows in the Western US. Hydrological Sciences Journal Volume 64 Issue 2. doi: 10.1080/02626667.2019.
 23853total visits,7visits today