The Earth’s hydrogeostrophic circulations, including the avg Jan and July winds animated above, and adapted from several decades of ECMWF wind data, again resemble a strange river to me. Other than the light blue overlays, the colors represent the strength of vertical winds at the surface. The surface is the lower boundary of any geostrophic layer slice I can imagine. The dark hatches are actually vectors of the horizontal wind, Even on returning visits, you may see that the entire patterns remain suggestive of an endless river network, with eddies and shifting shores at north and south. The central band in particular is perhaps purely the noted westward-flowing Equatorial Trough (ET). The eddies are mostly the tropical green bands, and they are bounded by the highly noted eastward-flowing winds (light blue fields).
More to come and meanwhile, here are the images that will lead. July 1979 at top, followed by Jan 1979. That order is not sequential but it at least fits with the relative position of the Equatorial Trough. For these, the darker the field the higher are the horizontal surface wind velocities. The dark regions only appear that way because of the settings when I auto-sized the vectors (arrows). As with the above animation, the yellow streamlines all originate and apparently end around each pole. The red streamlines originate from the east boundary. The red points represent the centers of several southern US states.
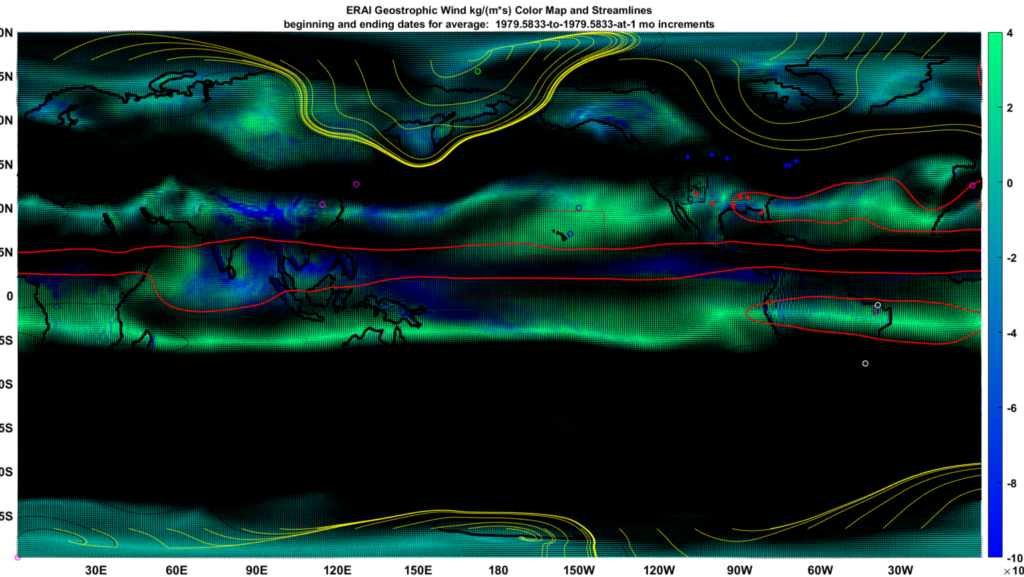
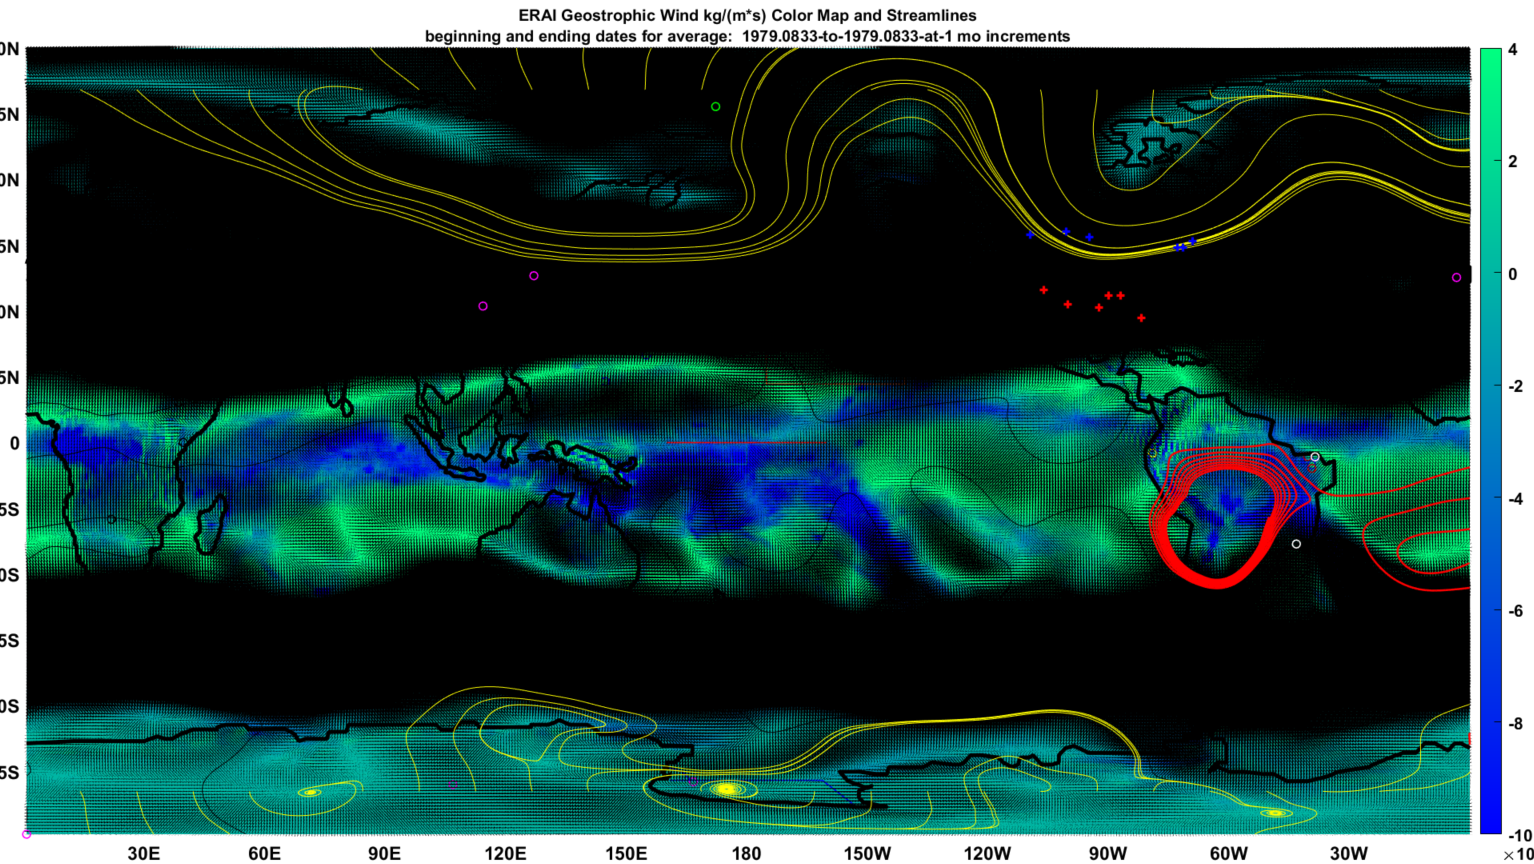
Every month is unique, and there are quite a few months to catch up on eventually. I’m favoring views of January and July because of their obvious value in reflecting extremes of seasonality for both poles. I’ve covered these same two months many times in the past, using slightly different satellite resources and parameters, including for the UCAR ERAI full atmosphere items: geopotential height, evaporation minus precipitation (EP), geostrophic full atmosphere thickness winds (so purely horizontal), temperature, and divergence of latent energy. Every parametric map for this is unique and worthy of examination in its own right. I thought that this new map set might add value as a way to capture (almost) areas of likely precipitation (deep blue falling air), gyres and high pressure zones (light green?), regions of high advection (black, dark), and various trajectories (streamlines).
And the directions of air flow in the darkest areas of the middle latitudes and the equatorial trough, are already well known so I don’t have to add anything there. Think of those regions again as rivers in which the flow directions are well known (if you can wrap your brain around a river with no clear beginning or end).