Are stories of the primary element Oxygen O[1], and its 1954 novel namesake [2] quantumly entangled through various background threads and posts? Those relate how aqueous pH impacts both lightning and ozone. My continued work includes investigations of the geostrophic sensitivity of atmospheric ozone O3 to Water H2O. It is the same to me, no matter what such an investigation is called. It usually spins around basic realities of the Points of Zero Charge (PCZs) in our hydrosphere or equivalent sample. That sometimes can boil down to how lightning/electricity and pH relate. Nothing may be more reproducible if protocols are followed, than the measurement, if not control of the electrochemical PCZ, especially through a glass electrode pH meter GEPH.
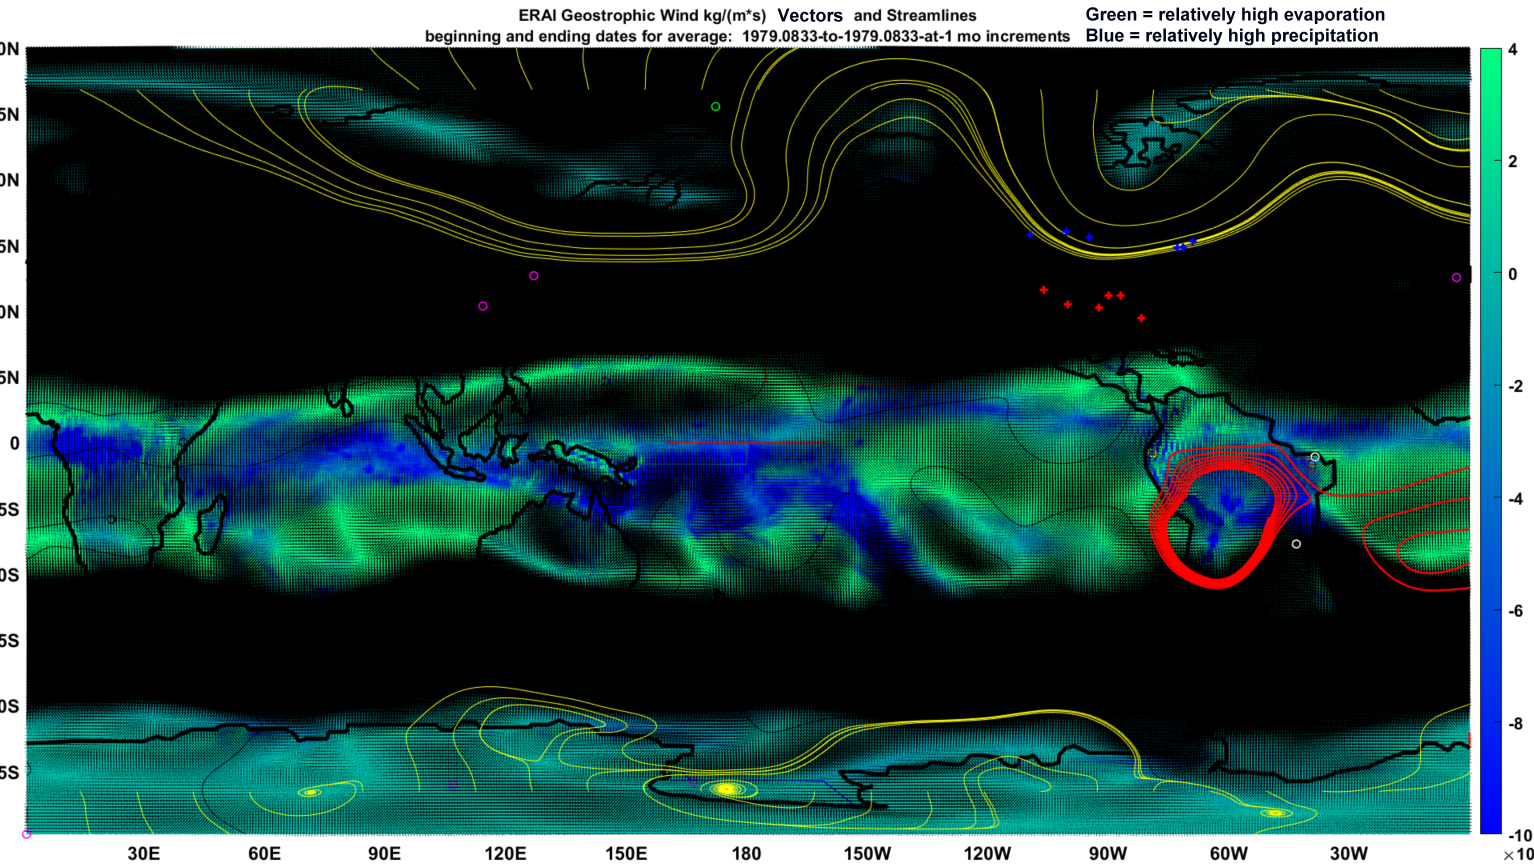
The remaining mysteries follow different directions than the sort favored by the dominant population of academics who work to slave ozone to their own polarized vision. That vision bears more resemblance to the novel than some might ever imagine. It is true that one can anthropomorphize virtually any dynamic feature of the atmosphere. The featured image, following work I recently coauthored on pollen and seasonality of respiratory viruses [Nature Scientific Reports article] demonstrates an example of a global geostrophic month where the bright blue intensification indicates precipitating moisture across the abundant coils of perpetually circulating and renewed air, that ring our equator and spin from east to west.
The bright red loop is only coincidentally a metaphorical O. Nor is it a noose or necklace novel device. It is not even a collar and leash, but rather only an artifact of a streamline that got caught up in a temporary atmospheric gyre. The black patches and columns also represent zones of highest geostrophic wind velocities, regardless of their direction. One can still infer at least a metaphorical deep river of fast-flowing air on either side of the tropical surfaces.
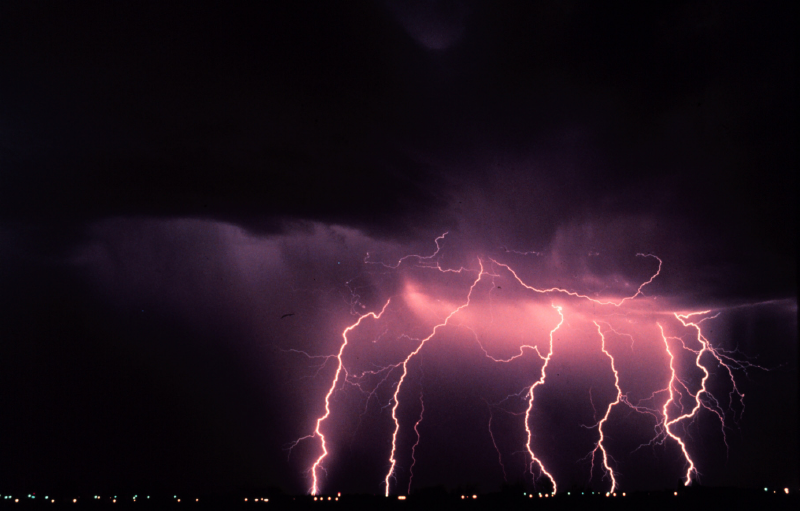
The featured image also happens to seem much like other artworks here. Any will reach their own interpretations. I believe perhaps in line with Reshetov [1], that the blue patches suggest where water of a naturally lower pH was brought down to the surface from the atmosphere, altering PCZs in the relevant scales and triggering lightning. Lightening fuels ozone production. The featured image suggests as with many if not all of the other months, some of the lightning-fueled O exits the equatorial divergence zone via the evident channels into those high velocity geostrophic rivers.
This is a much different vision for the interpretation of ozone morphologies than the current approach that aligns closely to the fictional work. Consider the following animation for a sampled month of Jan 2014 of water vapor and ozone. The default frame is an atmospheric moisture index for January 2014. The deeper the red, the higher the proportion of atmospheric H2O. Click on the image and it will cycle with another frame from the same month and year for Ozone.
As with water, the deeper the red, the greater the concentration of ozone. In the dynamic perspective of additional months, it also seems that the ozone only can persist where atmospheric moisture is sufficiently low. This is only an opinion blog, so I can arbitrarily call that “lowzone” moving forward. There is ozone in the low H20 spaces, so long as solar UV reaches at least the atmospheric layers that are already dehydrated.
Again, H2O may be associated with the genesis of O3 through PCZ inflected lightning. Any other combination of ozone and warm or cold air that is high in moisture, reduces the ozone most abruptly. Ask any industrial chemist, and note that the ozone map, like the atmospheric moisture map are represented for a 60km thick slab of atmosphere that enfolds the planet. That covers the ozone layer which tops out around 40km.
It seems that I obsess unhealthily with the stories of O. I can’t un-see that, aside from the wet and stormy lightning connections which account for a significant proportion of ozone’s genesis, the intersection with any humid air usually signifies the end of ozone. Under routine climate conditions, because of obvious chemistry and thermodynamics yet to be recognized by any atmospheric subject matter expert, they cannot mutually coexist for long.
Naturally these topics only scratch the back of the entangled surfaces. pH after all was once known as the embodiment of the ocean acidification narrative. Yet one can never seem to find any maps of the ocean pH. Not even from this representation on the left in the below image, from the SATELLITE OCEANOGRAPHIC DATASETS FOR ACIDIFICATION at the laboratory consortium OCEANSODA. Rather, the presumed acidification site favors maps of alkalinity and not pH.
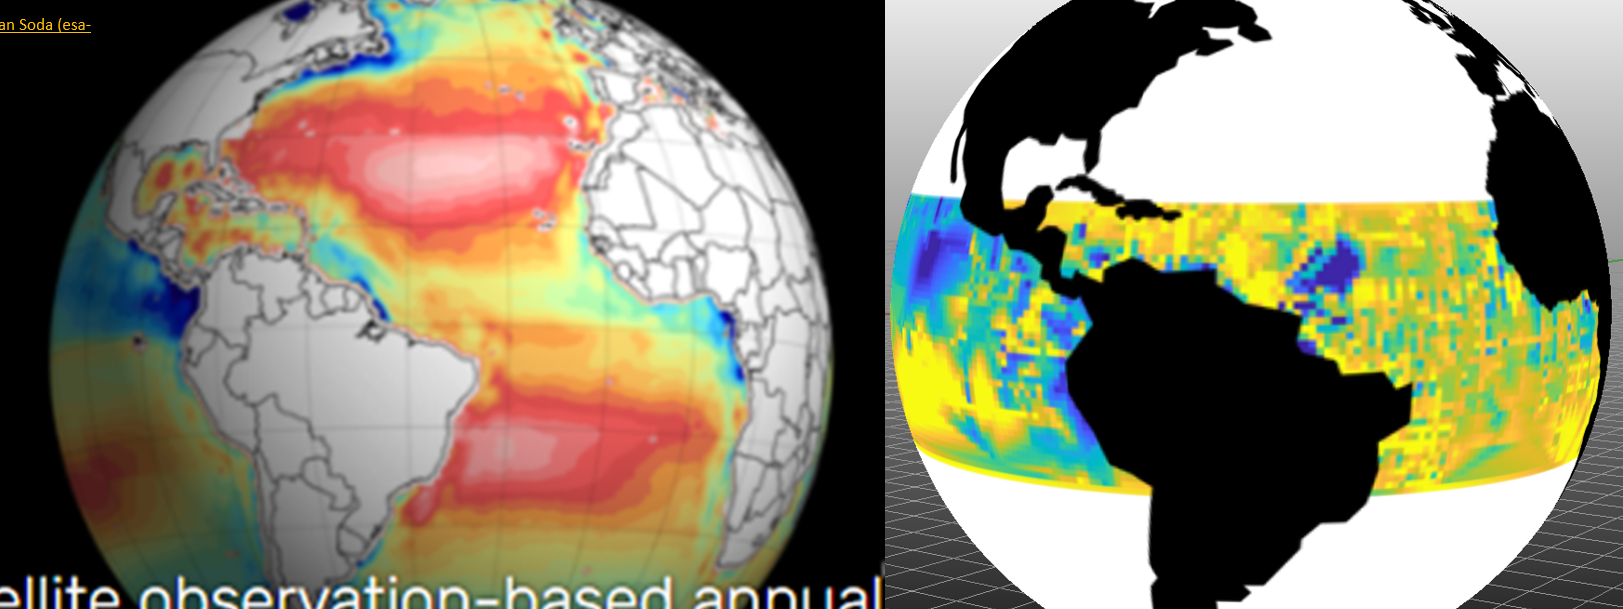
In contrast to that resource, this site frequently covers ocean pH data from NOAA’s World Ocean Database. A pH map in progress I’m working on from that resource (for the “golden years” of direct ocean pH measurement with gephs 1950 through 1990) is shown In the right hand image above. Both panels show low (blue) and high (yellow and red) patches blooming off of the northwest coast of South America. On the left, the ranges are for alkalinity and on the right the ranges are for geph-measured pH. This is also a rough qualitative comparison because on left, the alkalinity is averaged from 2010 through 2014. For right the NOOA WOD pH is averaged over years 1950 through 1989.
This casual correspondence seems roughly true around the planet. The alkalinity representation is developed through conventional data fusion and apparently non-causal regression to parameters that actually can be and are remotely sensed by satellite. For presuming to capture the mysteries of pH with such a stiff and limited covariate set, this is very sad. In any case, no matter how learned their machines, one cannot directly measure alkalinity without conducting the titration exercises. And one can’t do that efficiently or accurately without directly measuring pH with calibrated gephs.
In contrast, on the right panel above, there is much less interference and munging. The geph measurements are simply averaged and interpolated through routine algorithms. This is only a blog and all of my interpretations are draft and informal, but there is nothing exactly mysterious about the intimate connections between alkalinity and pH. Or perhaps they are as mysterious as any other relationship. There is always the potential for drama, given that pH is intimate with other partners including temperature and non-carbonate dissolved minerals. If you wanted to be cold and clinical, you could say that alkalinity is the geph-measured titration result of any seawater sample down to pH of 4.5.
The above is a preview of coming work I’ll share that is more complete for the pH coverage. I favor pH ocean data prior to 1990 for the most part, for reasons that relate to a shift in how researchers choose to elevate DIC, dissolved inorganic carbon. Ocean acidification experts continue to promote pH as the exemplar of ocean acidification, but won’t permit themselves to report in peer journals on ocean pH global distribution from similar measurements to those they use for alkalinity anyway. That is apparent from peer review war stories, the comparison above, and a close read of OCEANSODA’s project overview:
“The long-term uptake of carbon dioxide by the oceans is reducing the ocean pH, a process commonly known as ocean acidification. The uptake is also altering the ocean chemistry and ecology, impacting marine ecosystems on which we rely. Recent work highlighted the potential of using satellite observations to study the marine carbonate system (Land et al., 2015; Salisbury et al., 2015) and initial efforts have focused on satellite retrieved sea surface salinity and sea surface temperature data through exploiting empirical methods (Fine et al., 2017). These techniques complement in situ approaches by enabling the first synoptic-scale observation-based assessments of the global oceans and are particularly well suited to monitoring large episodic events.”
Given the above ensemble of machine learning, data fusion, and proxies, it could be interpreted that there actually are no sites for direct satellite observation of ocean acidification. It may even be that the deeper you bury your muzzle into the dark and furry chemistry of aqueous carbonates, the more you might appreciate how much alkalinity is NOT about acidification.
I have to write often about the most natural geospatial cyclostationary and trending water and ozone and pH puzzles, in part because other scientists will not. The humidity – ozone climate relations, along with the alkalinity-pH cominglings appear to remain as privately circulated as O’s novel experiences.
[1] see Periodic Table of Elements and Reshetov, V.D., 1965, ON THE MECHANISM OF ELECTRICITY GENERATION IN THUNDER STORMS, Nature of Aerosol Particle Charging. NASATT F-9656. ST-AM-10 30
[2] see this link for example and it will eventually take one to the novel through the later perspective of the author Anne Desclos.