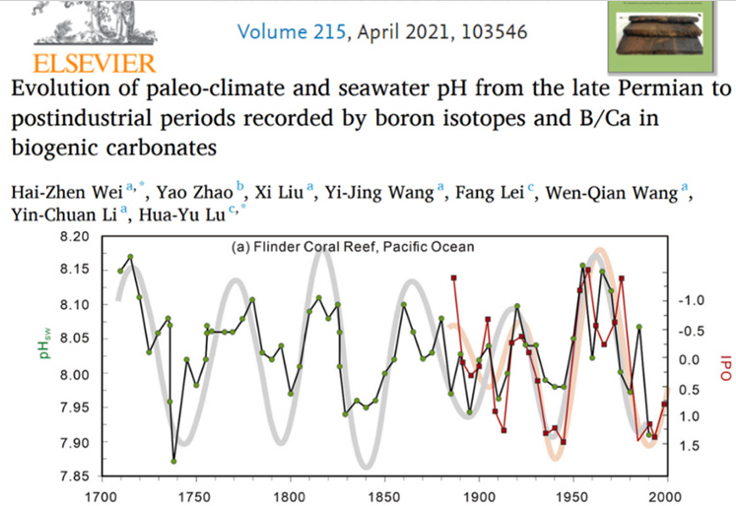
If you won’t take my words for it, consider this figure above. The paper supports again that Ocean pH relates to a semi global temperature cycle known as the PDO. Or if we must split hairs, the IPO (light gray band, I believe).
At least they wrote “Large variations in reef-water pH from 7.9 to 8.2 showed an interdecadal oscillation and co-varied with the Interdecadal Pacific Oscillation (IPO) index over a period of ~ 50 years (Fig.12a, Pelejero et al., 2005).” We are on part of the same page. I’m on the wrinkled part where ocean acidification is wrong and irreproducible. They are more accepting, but otherwise refreshingly open minded and query-passionate. If only we don’t have to wait until hell freezes over before they recognize this work charted below.
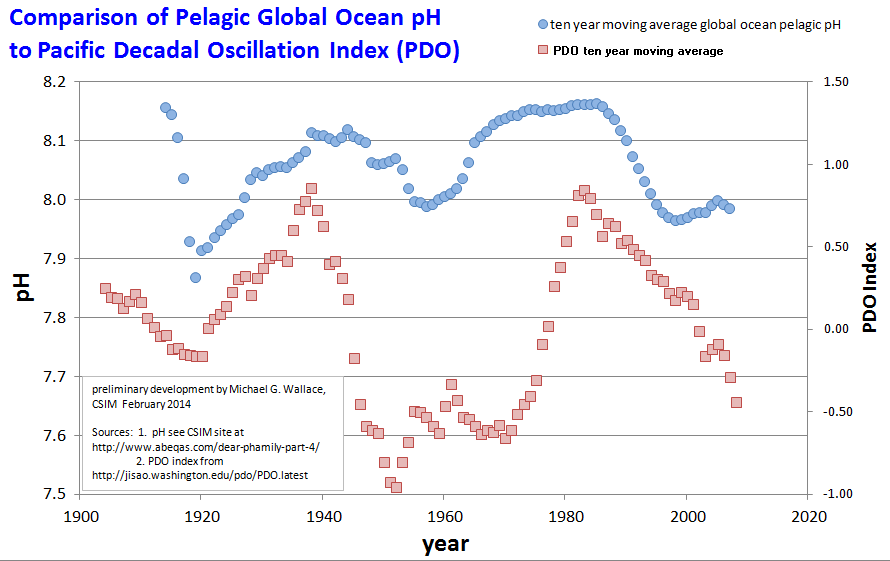
I’ll be sure and examine their Pelejero et al. reference. In any case, the ocean glass electrode measured pH record is every bit as appropriate to use as related records for its close associates such as temperature and alkalinity, as well as salinity, iron, and oxygen… and more. And it doesn’t hurt to mention that when averaged over decades, much of the signal to noise ratio is reduced, which can be a welcome development. Accordingly a link here to some additional charts illustrates even more examples of time series I’ve encountered that seem to share the Ocean pH glass electrode record’s lovely curves and rhythms.
What’s more, a remarkable bloom of ocean upwelling information is coalescing and transforming the landscape of both Ocean Acidification and Greenhouse Gas Accounting. While many wait for the other shoes to drop, I’m working with this information and doing some additional coalescing with other colleagues’ interpretations and insights. Here’s an example of some CO2 atmospheric information that we are comparing against other resources, from that related information bloom. See one or more of my posts on seasonal atmospheric CO2 for helpful context.
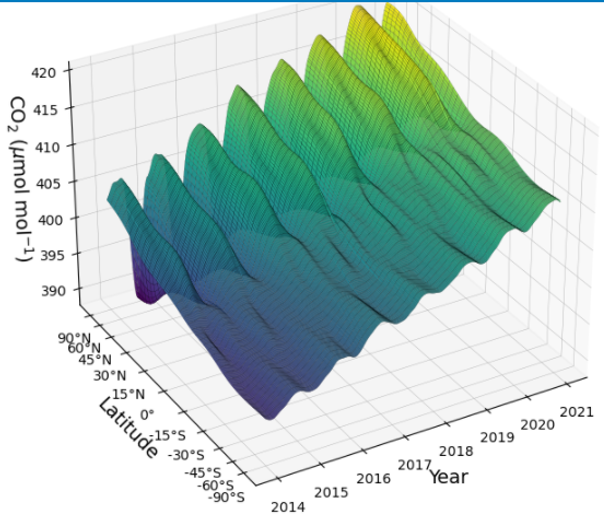
It is also clear to me that many representations of the concentration of CO2 in our atmosphere are inconsistent. In the prior link as well as the above figure, one can see that CO2 is not well mixed in the atmosphere. In other words, a single metric number, such as the number du jour which is 414.51, is not appropriate to report to all of us. Even this figure above is inadequate. Given other data from that information bloom, I hold a current opinion, that the NOAA figure has overlooked the most major peaks and dips of carbon dioxide, as well. And as usually the case, I’m working on a related topic and have to wait to present something if only out of respect to all colleagues. The unexpected outcome for many who follow the data and many of the best papers, will likely be that the natural carbon cycle accounts for the lion’s share of ocean carbonate chemistry, and of ocean pH, and dare I say, atmospheric CO2.
Currently we appear to under-appreciate the contributions from annually burped CO2 plumes triggered by seasonal wind intensifications across Arctic and Antarctic coastal regions, It’s nice to know at least by the featured paper above, that the use of glass electrode pH meters is returning. That return may have come too late for my UNM dissertation need, but in any case along with that, the coastal upwelling papers continue to advance and mature and grow. Things may get interesting.
Thanks Bob!