Prior to this summer, after I shared a chart I developed from satellite data, a few experts agreed with me that the Antarctic area has been cooling significantly. I hope that chart lures them to the same perspective I’ve dovetailed into. If the southern third of the planet is cooling, and the middle third is not warming, then the Earth as a whole cannot be warming. For example, one of these three claims is not like the other:
- May-June, 2021: Abeqas.com claims that global satellite records and more indicate long term cooling and ocean freezing across the Antarctic latitudes and beyond. The resource which I authored includes a comparison to various data. This has been viewed over 20,000 times to date from URLs around the world.
- July, 2021: Physics.org, a major institutional science publisher posts: https://phys.org/news/2021-07-183c-antarctica.html implying the opposite, i.e. more warming of Antarctica. They asserted “The United Nations on Thursday recognized a new record high temperature for the Antarctic Continent.”
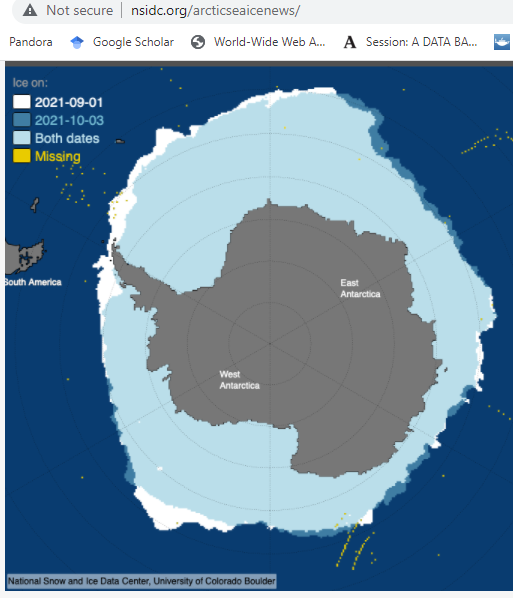
- October, 2021: A report from NSIDC that “On the Antarctic continent, the winter of 2021 was among the coldest on record.” Here is a nice image from that resource:
The middle article, which is the Phys.org piece (2 above), focuses on the extreme tip of the Antarctic Peninsula, very close to South America, and never mentions the observations profiled in 1 of epic Antarctic continental cooling. The authors do appear to believe that what happens on the remote tip of a peninsula thousands of kilometers out, is a bell weather for the bulk of a high and dry continent. It would be much like arguing that Florida temperatures are the best indicator for weather and climate in the Canadian Rocky Mountains.
In any case, these three claims all cannot be right. I have an opinion that because of the lack of disclosure on the actual cooling state of the full continent, the Phys.org claim (2) is very wrong. Of the remaining two, the abeqas.com site is the most transparent but you can be the judge if you choose to visit all. I did just now try to update my own time series chart from (1) using past resources at UK Met office, but all of those station data sets appeared to be closed down when I attempted this the other day.

Please visit [1] for the best context on this graph. In short, it reflects a disconnect between pressure and temperature which, given the dry Antarctic interior climate, is eyebrow-raising. This is a blog with opinions. I also revisited the NASA GISS site. An example follows soon, but first, there is simply no substitute for satellite reanalysis data when you are trying to capture a meteorological parameter trend such as surface temperature, over decades, across the entire planetary surface, with reliable continuous information on a daily or monthly scale.
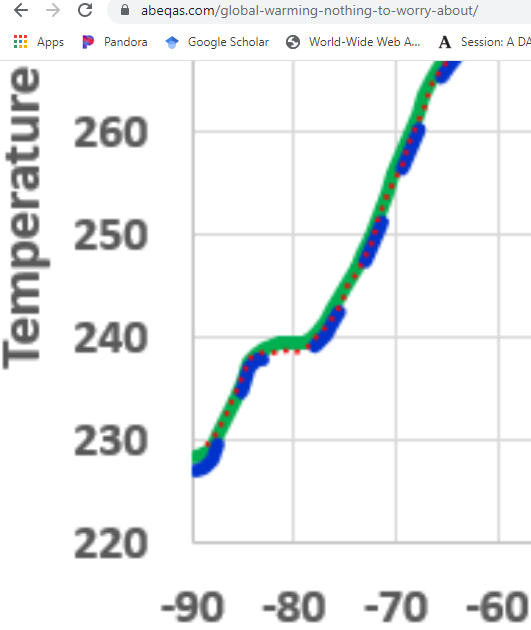
To continue to study, I developed the example chart below. NASA GISS non-satellite data indicates that temperatures for Antarctica latitudes have been rising about half of a degree since the dawn of the satellite era in 1979. In comparison, the actual satellite data (black) appear to demonstrate that temperatures for the same latitudes and time span have actually dropped by about 2 degrees. The trends (dotted lines) and axes can be consulted to confirm. I could certainly place these on a single scale but I wanted all to see all of that data, within a third of a page.
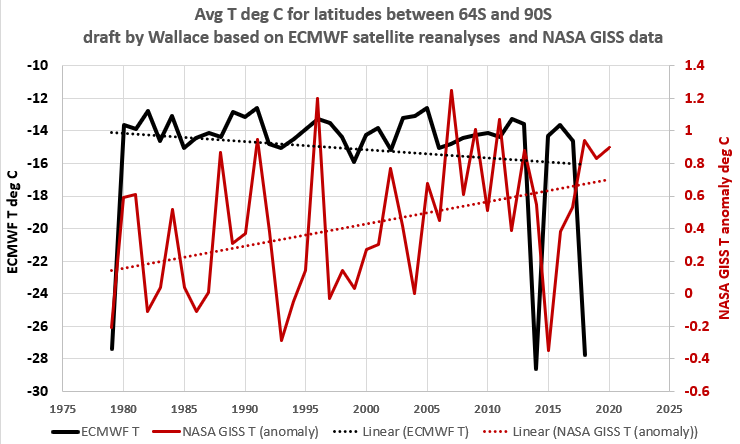
We both can’t be right, and a fabled space agency that disregards satellite data seems odd. They do actually archive some satellite data. That data is hard to access in comparison to the ease of viewing their satellite-free temperature representations. One might need an advanced geospatial capacity to review the AIRS temperature datasets they offer. In any case, I just forwarded this chart above to them and I’ll report if I hear anything blog-worthy: Ok, my perception is that I received some agreement that the NASA GISS record for these latitudes trends up, and that these spotty temperature measurements don’t necessarily align with satellite records. Many thanks to them for great responsiveness and candid communication. I welcome further communications with those people and any advice they can offer. If only Gavin Schmidt their leader would be so candid. Regardless of partisan leadership, I recommend that they belatedly now include this prominent eye-catching DISCLAIMER with every graph:
WARNING:  SATELLITE BASED TEMPERATURE TRENDS CAN CONTRADICT OUR REPRESENTATIONS, AS DOCUMENTED AT NUMEROUS POSTS OF ABEQAS.COM

If Antarctica has been cooling as long as the Arctic has been warming, why do scientists not mention both in the same breath or publication title?  In order to better understand, I once discussed Antarctic cooling with Arctic experts. I liked interacting professionally and appreciate their work and insights.  But I feel that they should work on balance when communicating about polar climates. I may have shared a chart much like the next image with them.  The original link (May, 2021) shows the extended coverage for the full range from South Pole at left to North Pole at right.
You can only imagine how these patterns play out to the north. Or you can visit the link. The full chart corroborates introductory words to the effect that 2/3 of the planet have not trended warmer. And the above shows that at least one third has trended colder. Yes, I did happen to pick two later years, 2014 and 2018 which were particularly chill, as documented in the previous chart above this one. In fact, this is taken from another work in progress, in which, naturally, I include all years. I picked 2014 because it was the final year of the UCAR set and 2018 because that was the final year of the next ECMWF surface parameter set. That work in progress will almost surely cite earlier work of mine [6] and Easterbrook et al. 2016 [7] as well.
Finally, for Arctic climate, the scientists do use satellite assets to monitor and report temperature and more to the public at large. But in the Antarctic, they do not. Many leading climate scientists accordingly appear to assert that land surface and ocean based temperature data are superior to widely relied on satellite reanalyses data. Otherwise they would not continue to aggressively signal that the globe is aggressively warming.
They should write a paper about their notions. While others wait for them to play catch-up with the Satellite Age, perhaps the rest of us can move on, before Hell actually does freeze over.
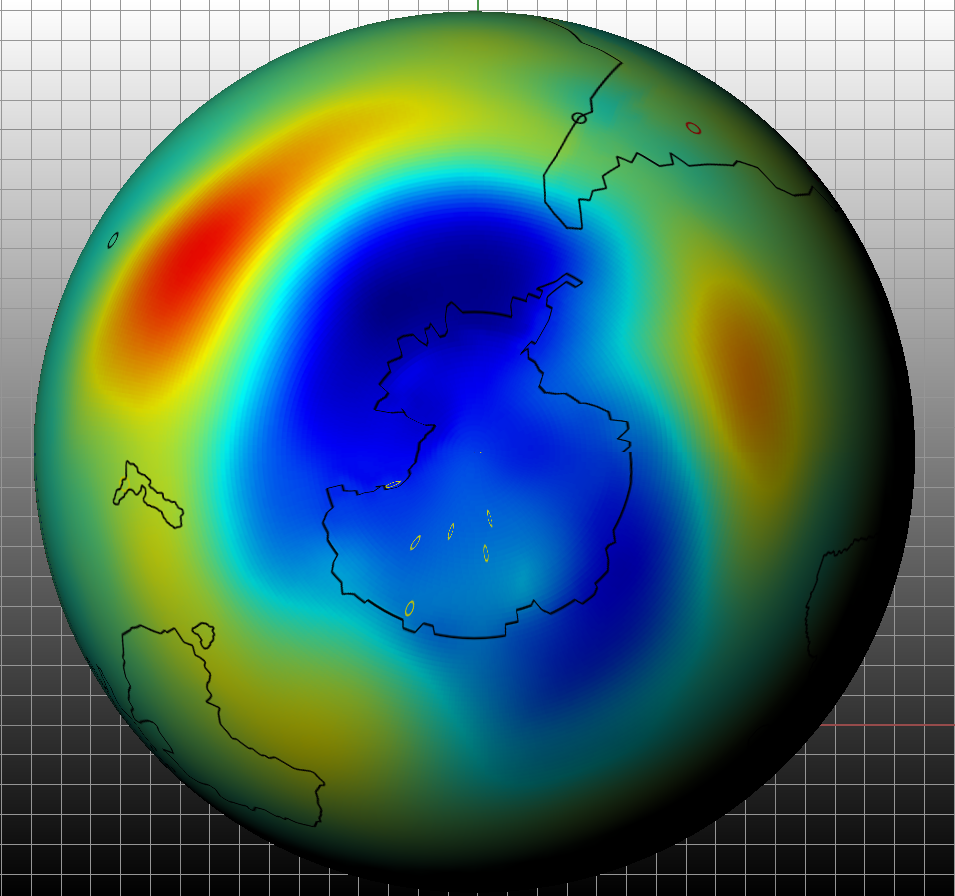
About the title image: I developed this (draft) global geostrophic temperature trend map from 36 years of data for the full atmosphere based on UCAR resource [4], which itself was discontinued after 2014. Blue shades indicate a cooling trend for the full atmospheric thickness and red shades indicate the opposite. The stretched gold rings are for another project.
[4] University of California at Riverside (UCAR). Integration of ERAI Satellite Reanalyses Products. http:// www. cgd. ucar. edu/ cas/ catalog/ newbu dgets/ index. html# ERBEF s—file ‘ERAI.LEDIV.1979–2014.nc (2015).
[5] Steig, E.J., Schneider, D.P., Rutherford, S.D., Mann, M.e., Comiso, J.C., and Shindell, D.T. 2009 Warming of the Antarctic ice-sheet surface since the 1957 International Geophysical Year Nature 457, 459-462
[6] Wallace, M.G., 2019, Application of lagged correlations between solar cycles and hydrosphere components towards sub-decadal forecasts of streamflows in the Western US. Hydrological Sciences Journal Volume 64 Issue 2. doi: 10.1080/02626667.2019.
[7] Easterbrook, D.J. 2016 Chapter 7 – Evidence That Antarctica Is Cooling, Not Warming in Evidence-Based Climate Science (Second Edition) Data Opposing CO2 Emissions as the Primary Source of Global Warming2016, Pages 123-136
https://www.sciencedirect.com/science/article/pii/B9780128045886000070