To be clear the featured image above covers a wind parameter, not CO2. The image below does cover Atmospheric CO2. To this day, it is apparently impossible to find vetted and published CO2 concentrations from satellite atmospheric soundings south of 55S.
Perhaps some of the mystery can now be eliminated. The concept is easy and well known: enhanced seasonal winds stimulate ocean upwelling of dissolved CO2 (DIC).
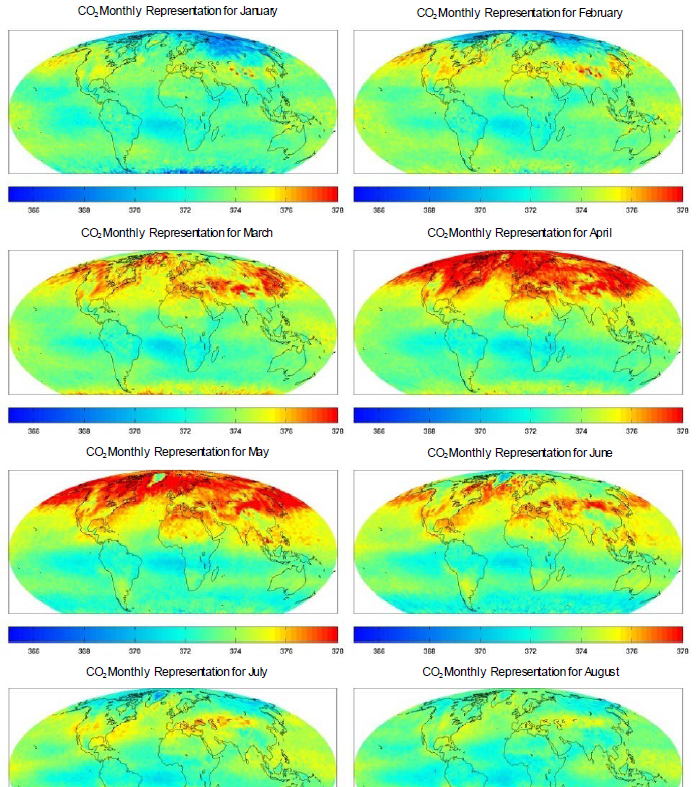
These images, from [3] appear to corroborate seasonal wind forced upwelling of DIC in at least the Northern Hemisphere, but the reference doesn’t appear to be widely cited. Nor does [3] include information below about 55S Latitude. This is not publicly explored yet. But in any case, I’m happy to be among the first. I simply can point all to some seasonal wind excerpts below (adapted from [1]) and a glance at the southern strip of CO2 that is shown above.
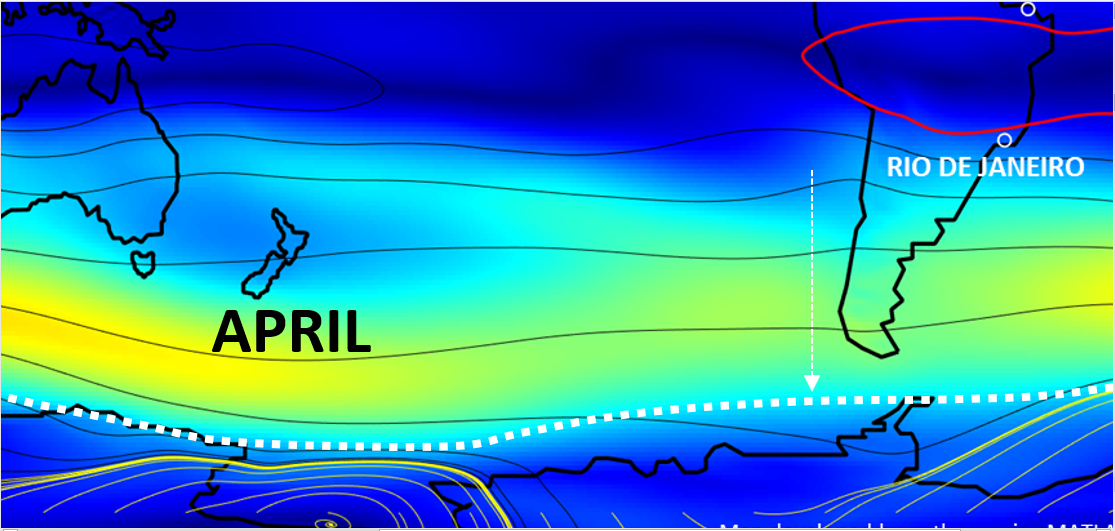
The brighter the red color, the higher the absolute magnitude of geostrophic wind.
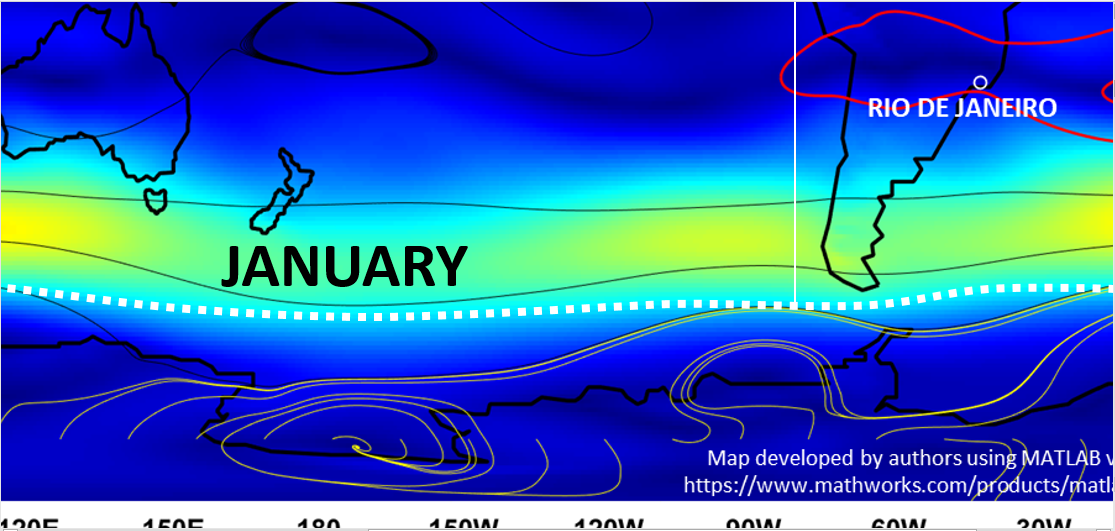
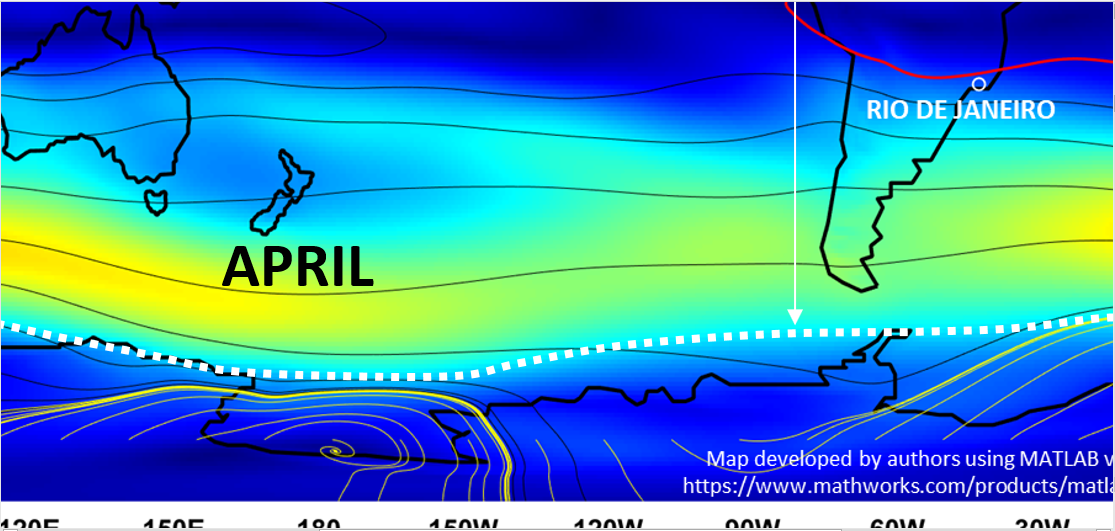
Clearly near-polar zonal winds pick up in magnitude at similar months on either side of April. The Southern Polar region experiences this about a month earlier than the Northern Polar region and see [3]. Also visit [1] for expanded seasonal views.
To recap, Southern CO2 upwelling is interpreted to be highest along the Antarctic coast in March and April, through a correspondence to geostrophic winds. I must interpret because almost all data access is unavailable. The concentrations of CO2 in those latitudes at those months, are possibly very high. They may exceed the highest reported estimates to date for the globe, or they may not. We will only know how high, when the information is provided to us.

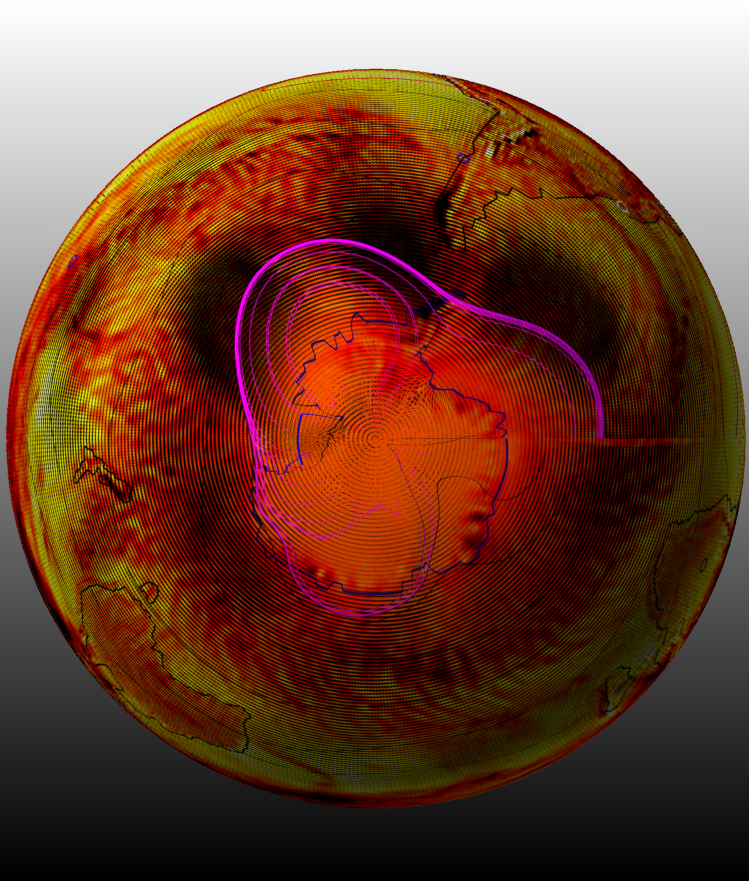
One can expect to also see more dynamic CO2 patterns, if less seasonally averaged winds are factored in. Below covers an example for April, 1979. The background color relates to another parameter, but the dark zones reflect high velocity wind fields.
There are other relations to understand, including the seasonal atmospheric spreading of a heavier-than-air upwelled CO2 gas, and the extraordinary 40 year trend of expanding seasonal Antarctic sea ice. Unfortunately, research funding continues to favor works that do not interfere with unverifiable bean counts of CO2. One wonders what is the point of civilian CO2 satellites that don’t report timely CO2 information and related educational content to all of the public.
Sure there are other CO2-interpretable satellite data out there. But none have put things together like [3]. In any case, one only needs to revisit that bloom of CO2 in the north. It seems to be a robust seasonal (March-May) bloom of CO2, with impressively high concentrations. Concentrations might be as high as any other contemporary claim of that era. The fact that driving and industry don’t shut down for the other months is why you might agree that climate change scientists now must join the rest of the scientific community and defend why their notion should persist. Perhaps a new peer reviewed paper by those parties, which cites this post might add value for sustained and broader civil discussion.
It would be helpful to further discuss and explore all of the absent atmospheric CO2 data in this context as well. At least [3] profiled and featured the monthly compilations across much of the planetary atmosphere. Yet there is apparently no published CO2 data like the Pagano et al. satellite products for any equivalent planetary and climatological scale since 2011.
CO2’s purported heat trapping “greenhouse gas” property might be an oxymoron anyway, given that it has a lower heat capacity than dry or moist air under our natural surface temperature ranges. Heat capacity appears to share exactly the same meaning that is attributed to CO2 as a greenhouse gas. Another link goes into further detail that relates to all IR-active molecules including CO2. Rather than industry, upwelling and biomass production appear to account, as usual, for the two poles of the carbon cycle. The [3] paper appears to corroborate. I’m very much in support of anything that can be done to expand and update from that compelling work and then some. Let’s fill in the missing CO2 pieces soon.
References
[1] Wallace, M.G., Wang, Y. Pollen antigens and atmospheric circulation driven seasonal respiratory viral outbreak and its implication to the Covid-19 pandemic. Sci Rep 11, 16945 (2021). https://doi.org/10.1038/s41598-021-96282-y open access publication now available here.
[2] Wallace, M.G., 2019, Application of lagged correlations between solar cycles and hydrosphere components towards sub-decadal forecasts of streamflows in the Western US. Hydrological Sciences Journal Volume 64 Issue 2. doi: 10.1080/02626667.2019.
[3] Pagano, T.S., Olsen, E.T., Chaine, M.T., Ruzmaikin, A., Nguyen, H., and Jiang, X. 2011. Monthly Representations of Mid-Tropospheric Carbon Dioxide from the Atmospheric Infrared Sounder. Proceedings Volume 8158, Imaging Spectrometry XVI; 81580C (2011) https://doi.org/10.1117/12.894960
Event: SPIE Optical Engineering + Applications, 2011, San Diego, California, United States