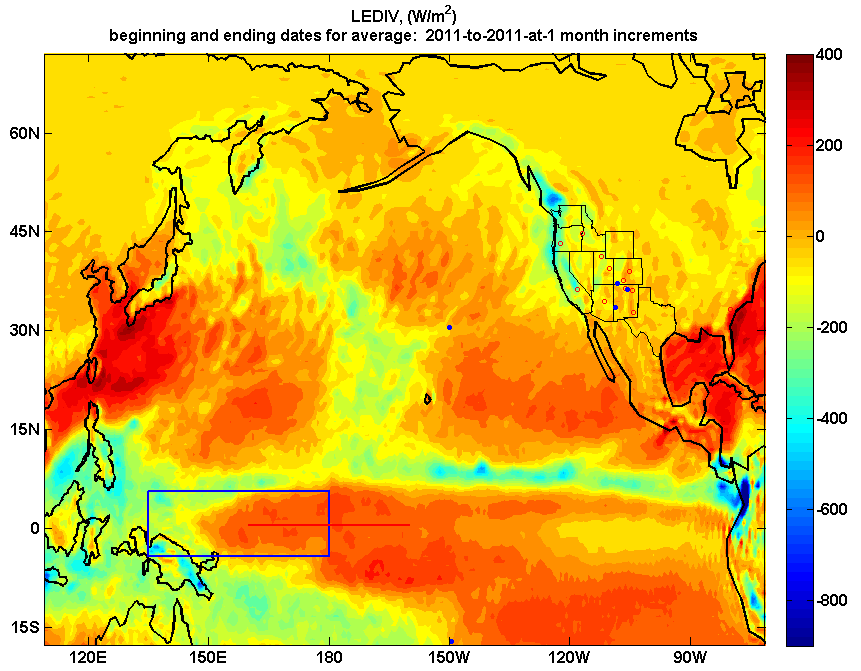
Latent heat in the atmosphere appears capable of accounting for the lion’s share of the global atmospheric energy budget. Consider the color fields which indicate great masses of plus or minus 250 W/m^2 for the full atmosphere. That’s about the net solar radiation balance and accordingly there is little if any energy left to attribute to any other factor, other than sensible heat.
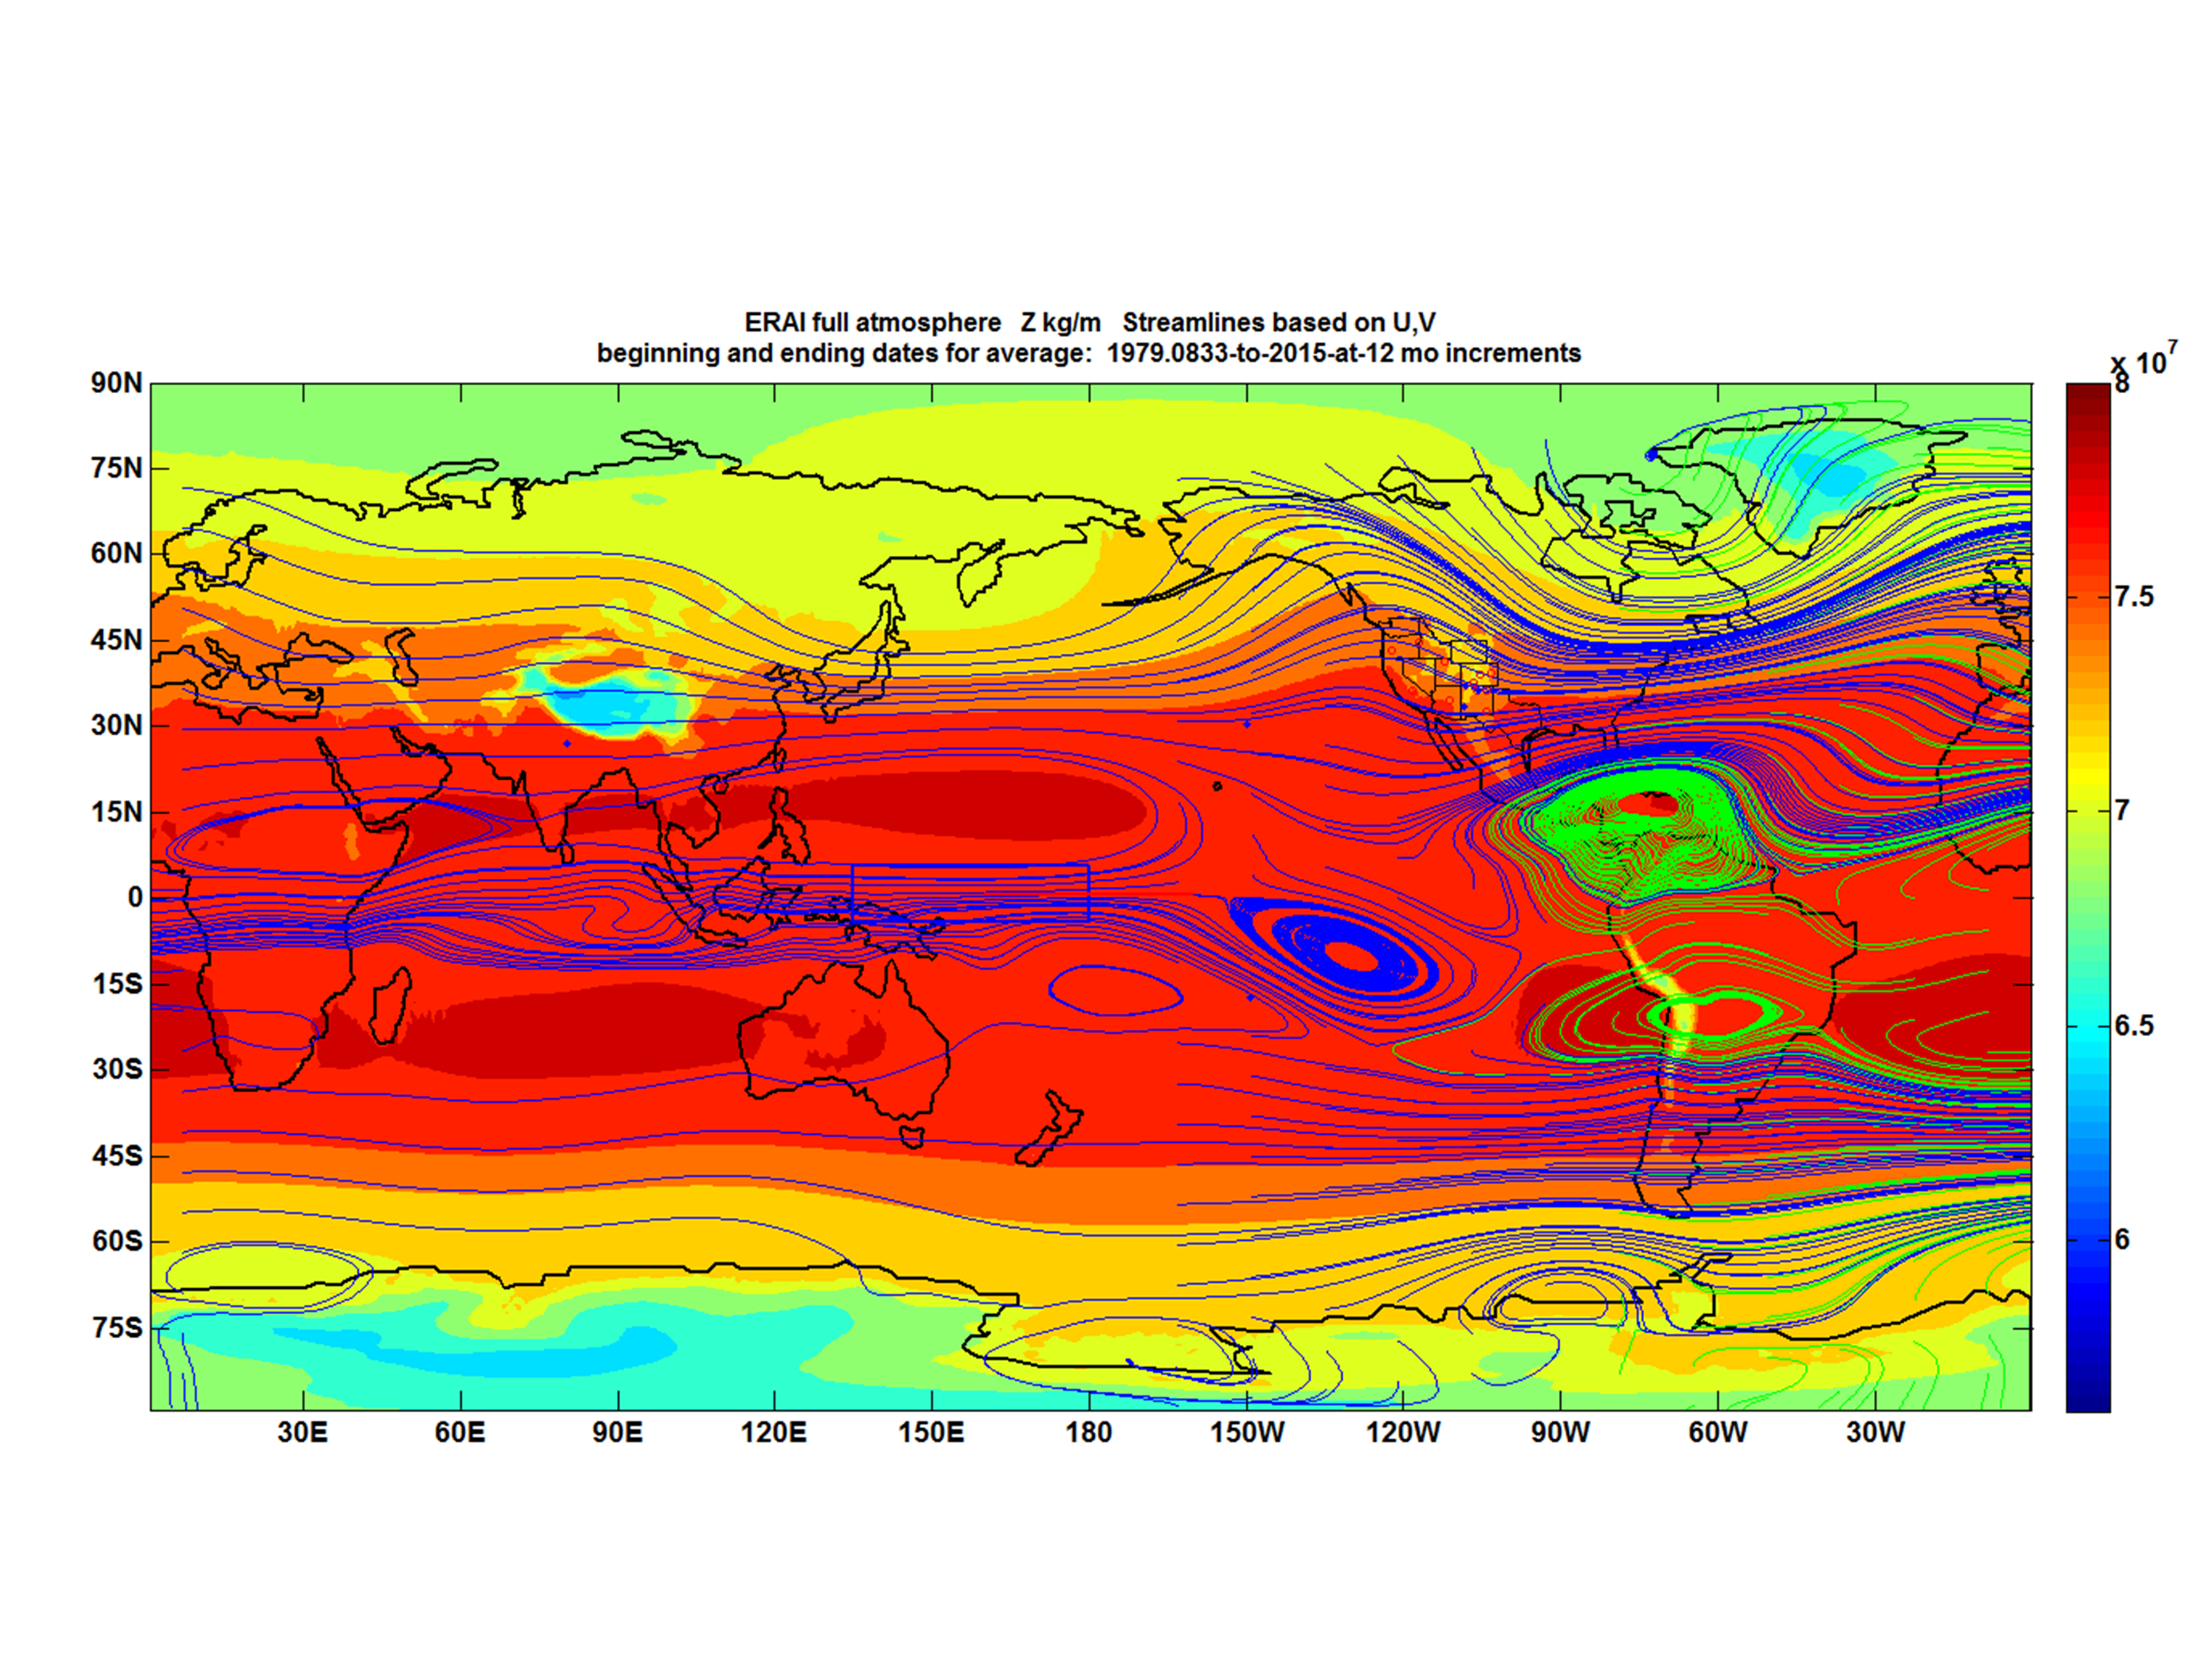
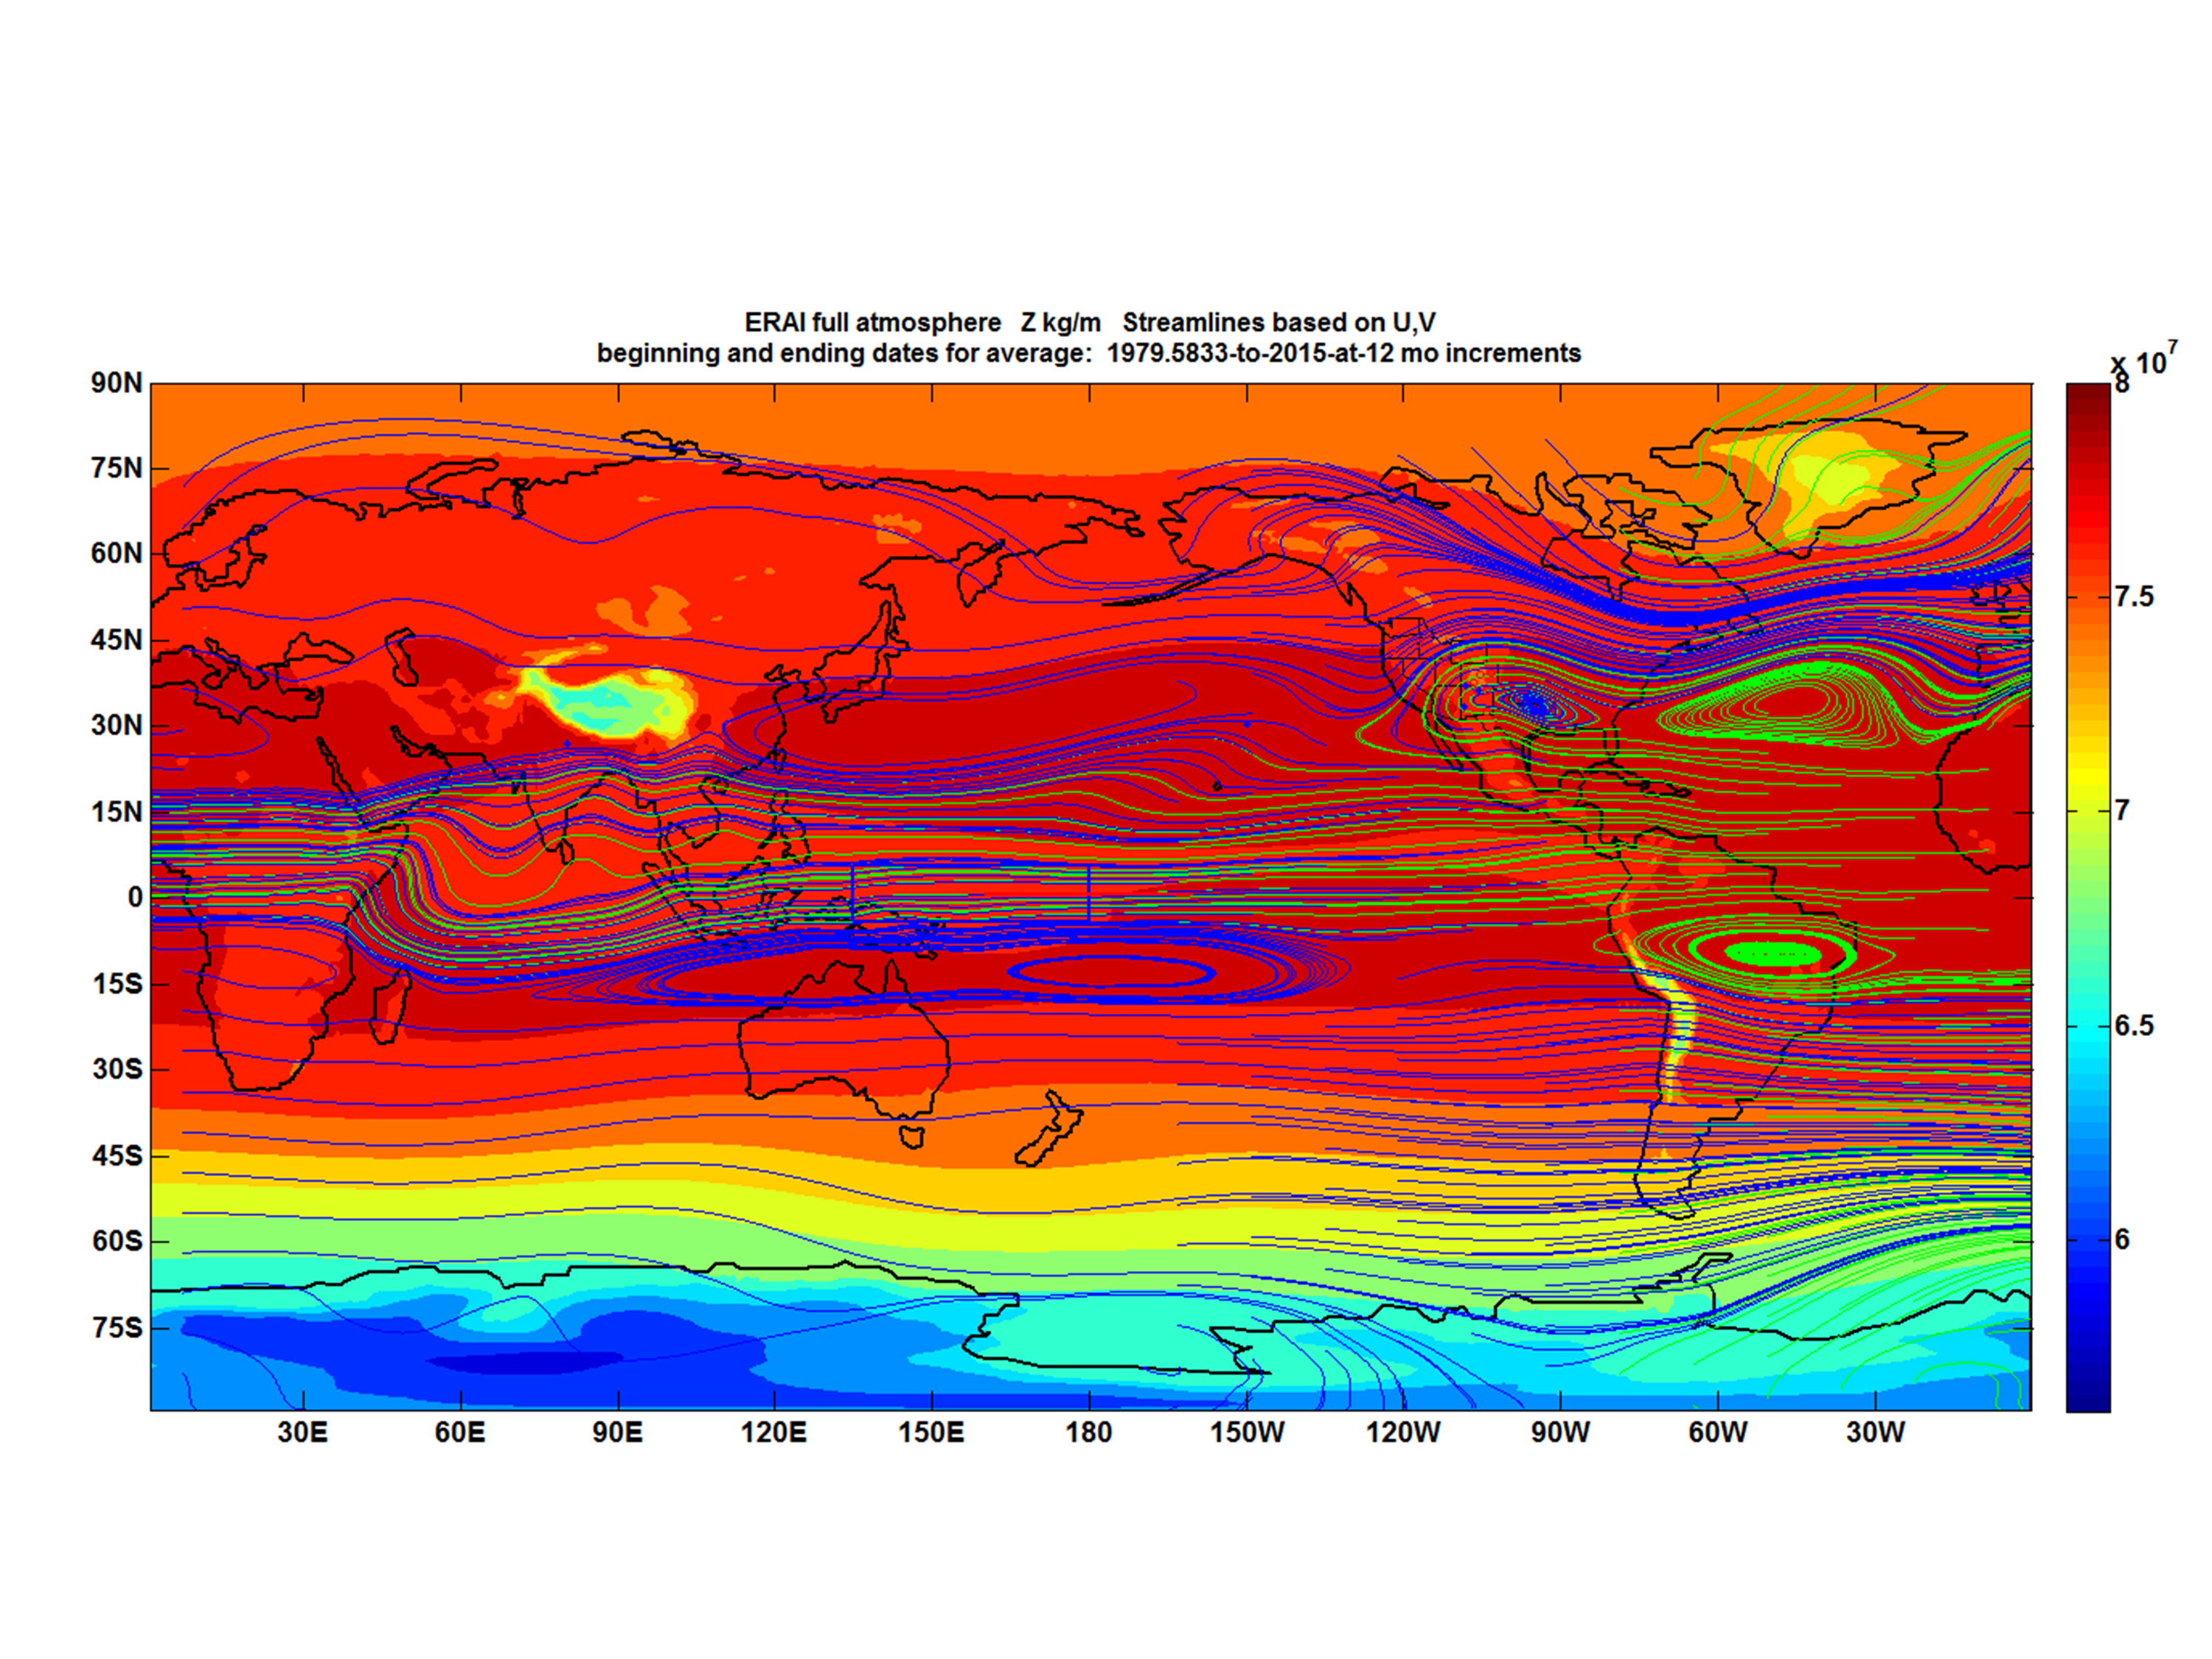
Latent heat maps of the full atmospheric thickness based on ERAI resources also express remarkable seasonal patterns which naturally complement the ENSO patterns outlined in this reference. The two images directly below demonstrate with regard to the Equatorial Trough (ET). Normally over a 25 year average, there is an easterly circulation of atmospheric parcels within the ET. Every monthly and daily average can vary but in general, for the average January, full ET circulation may be restricted. On the other hand, in July on average there is full and even enhanced easterly ET circulation across the planetary circumference.
Global circulation models (GCMs) virtually disregard the 800 pound gorilla known as latent heat. Yet GCMs are widely used by mainstream scientists to explain the atmospheric energy balance. It is not surprising that their GCM simulations are not only extraordinarily time-consuming and costly, but are also largely inaccurate and non-transparent. These extensive shortcomings prevail even in matching the contemporary historical record of moisture and temperature across the globe.
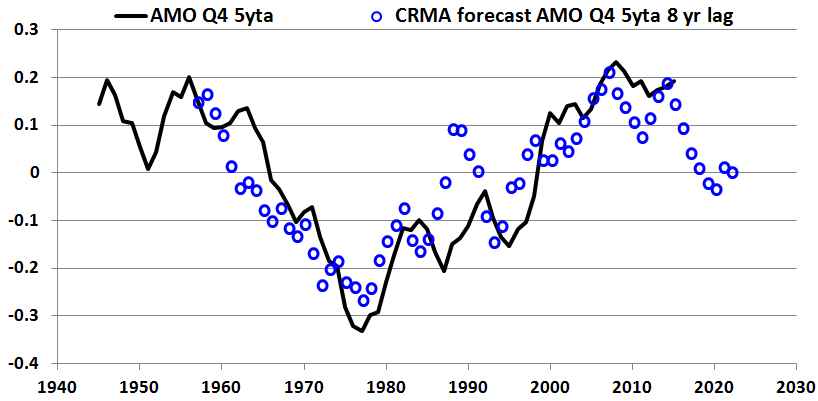
We choose to disregard GCMs, so long as they remain deficient in transparency and accuracy. Rather, our attention focuses on solar forcing, moisture circulation across the planet, and the associated latent heat. In this way we have demonstrated promise in more accurate forecasting of not only Moisture but also Temperature and associated Accumulated Cyclone Energy (ACE), along with closely related indexes such as the Atlantic Multidecadal Oscillation (AMO). The figure below demonstrates just how closely related these time series can be. Note that URGW T is a record of temperature for the full atmospheric thickness above the Upper Rio Grande Watershed in northern New Mexico, from a satellite coverage.

Our successes in forecasting are based upon systematic and rational explorations of precursors which relate to Solar forcing and global atmospheric circulation pathways. Given the above chart, if a precursor could be found to anticipate any one of the three time series, it would also add value in forecasting the other two.
The final figure shows a demonstration that we have already identified one precursor and applied it to a forecast exercise for the AMO. To see how this forecast has held up recently, click here. The location of this precursor may be hidden within the featured latent heat image. Or maybe not. We are a business after all with a better forecasting solution and accordingly seek customers who appreciate how improved forecasting of Temperature, Moisture (including Droughts), and Hurricanes can add value to both society and to bottom lines.
All sources available to customers upon request.