In looking at the full atmosphere, I am somewhat out of alignment with others both skeptics and promoters of emissions climate causation. They all appear to have preferences for which surfaces or planes or averages of the atmospheric pie are to be showcased. But I think you might agree that using all of the data for the full atmosphere makes sense at least for my particular studies, even as I target specific regions of the world to profile. In doing so, I have no alternative but to embrace the applications of geostrophic winds and the theories already profoundly explored and applied to this day for quasi geostrophic (QG) dynamics.
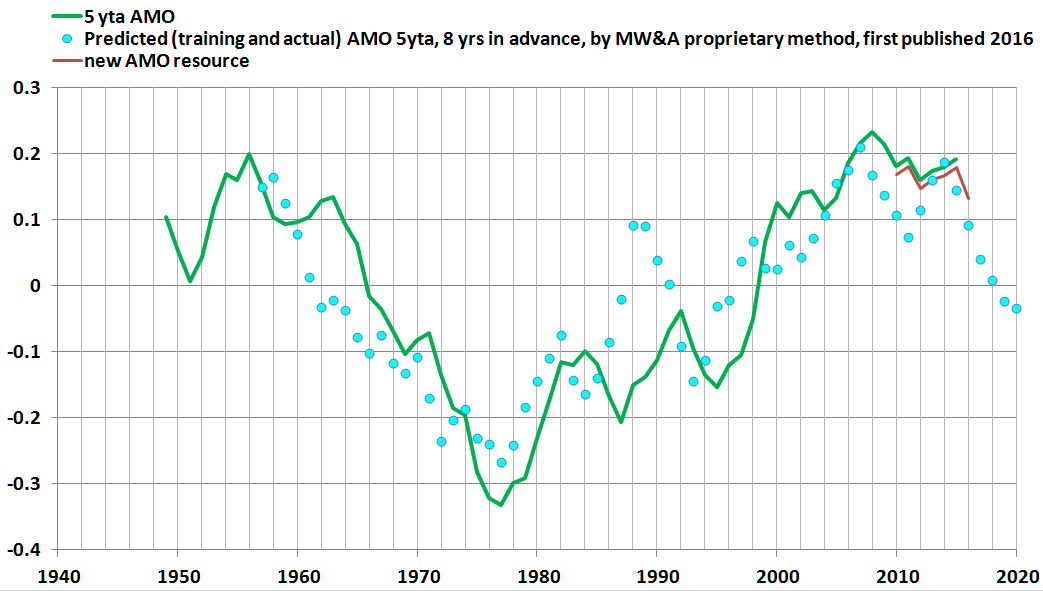
But this focus has led to some benefits, including a new forecasting product, of the five year trailing average (5 yta) of the Atlantic Multidecadal Oscillation index (AMO), for 8 years in advance.
It has been over a year since that forecast was first published here, and the featured image demonstrates continued high fidelity/accuracy of the forecast. I also continue to research in my Ph.D. work the physical phenomenology of this connection of the AMO to the precursor that I used, and to what extent the connection may be spurious. I utilize QG Theory as part of my analyses of those connections.
The image draws AMO observation data from the following link,
http://www.esrl.noaa.gov/psd/data/correlation/amon.us.long.data
This link is often updated, accounting for the “new” red line for observations. The green line was the original observation data which had been developed to compare the performance of the predicted AMO values shown by the blue (cyan) open circles. As mentioned, those forecasts were based on precursor data from 8 years prior.
Detailed updates and performance metrics of our signature AMO forecast will soon be available through our StochAtlas subscription.
A preliminary performance product is included in the table below, which is largely self explanatory.
| Performance summaries | ||||||
| * from http://www.socscistatistics.com/pvalues/pearsondistribution.aspx | ||||||
| ** from copyright 2007 DrJimMirabella.com spreadsheet template | ||||||
| forecast item | lead time (lag) yrs | avg category | calendar quarter | Precursor | number of samples N | number of decimal places |
| mwa11d CC to AMO 5 yta, 8 yr lag | 8 | 5 yta | Q4 | mwa11d | 36 | 2 |
| Correlation Results | ||||||
| percentile | percentile | percentile | ||||
| forecast item | Pearsons CC | Pearsons P-Value* | Significance at p<.1 ? | Significance at p<.05 ? | Significance at p<.01 ? | Highest Calculated Percentile of Significance |
| mwa11d CC to AMO 5 yta, 8 yr lag | 0.82 | P-Value < 0.00001 | y | y | y | 99% |
| Simulation Results | in Chi Test, the NULL hypothesis is that the distributions are similar | |||||
| Simulation Goodness of Fit, Significance Level 0.1 | ||||||
| forecast item | Root Mean Squared Error (RMSE) | χ Squared ρ-Value** | Chi Test Significance at ρ <.1 ? | |||
| AMO 5yta | 0.08 | 1.01E-06 | N | |||
As part of continuing process improvement even as we pioneer the process of producing some of the most transparently accurate climate forecasts available, I’ve added the two histograms extracted from the 5yta time series used for the χ Squared ρ-Value calculation:
AMO Observations
| Bin | Frequency |
| -0.33 | 1 |
| -0.28 | 4 |
| -0.23 | 0 |
| -0.18 | 4 |
| -0.13 | 7 |
| -0.08 | 10 |
| -0.03 | 6 |
| 0.02 | 1 |
| 0.07 | 2 |
| 0.12 | 7 |
| 0.17 | 8 |
| 0.22 | 8 |
| More | 1 |
| sum | 58 |
MWA Exercised Projections of AMO through a linear regression to a precursor variable
| Bin | Frequency |
| -0.33 | 0 |
| -0.28 | 0 |
| -0.23 | 4 |
| -0.18 | 4 |
| -0.13 | 7 |
| -0.08 | 7 |
| -0.03 | 5 |
| 0.02 | 6 |
| 0.07 | 7 |
| 0.12 | 8 |
| 0.17 | 8 |
| 0.22 | 3 |
| More | 0 |
| sum | 59 |
The χ Squared test is most unforgiving and does not lead to a determination that the two time series are from similar distributions. This is always an important metric to include and yet it simply points out that there is continued room for improvement. The extraordinarily high correlation coefficient (CC) between the observed and predicted variable of 0.82, at the very least points to a current record for forecasting of this parameter at this scale and lag. CC values over 0.8 are typically rare for any climate forecast known at this time.
Future Studies
I’m following up with some spot examinations of the temperature averaged over the full atmosphere from the ERA Interim products and comparing them to the AMO. Numerous aspects of my own research (profiled in various posts here) point to a global geostrophic temperature distribution that is not unlike the AMO. Accordingly sampled time series appear to confirm the promise that forecasting the 5 yta AMO 8 years in advance is somewhat synonymous with forecasting the 5 yta temperature 8 years in advance.
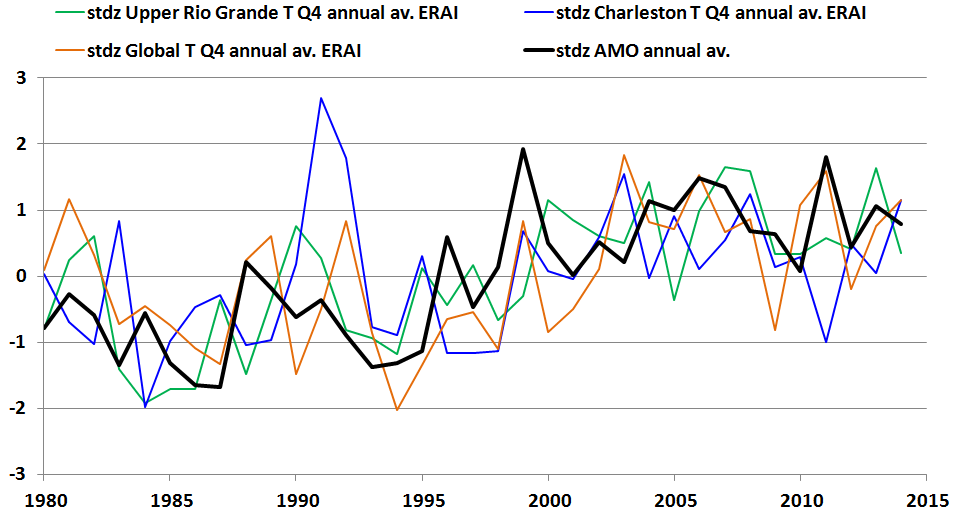
mwaAMOvsTemperature1
In a perspective similar to that of sports enterprises, it is our belief that all climate forecast vendors and their customers would benefit if the performance of all published climate forecasts are disclosed in a transparent, reproducible, and standardized manner. The standardization of that manner might also be a good subject for contemporary climate science and public discourse so that the benefits are optimized. This post reflects draft work in progress.