To the best of my knowledge, most other climate forecast practitioners do not publish transparent measures of the performances of their forecast record. As a hydroclimate forecaster, I would like to know how my own climate forecasts compare to those others. I think others might also want to know how different climate forecasting records from different sources stack up.
Accordingly every year I attempt to methodically build comparisons of climate forecasting skill between others including myself, by reaching out to other climate forecasters. In doing so I believe I am not only conducting some best practices for my business, but I’m also performing an important service for all forecasters. This shines a light on everyone’s performance, and just as for sports or financial statistics, this hopefully aids in continual process improvement on a level playing field.
This is just an informal exploration of a potentially important future independent joint practice, perhaps along the lines of CMIP. The key differences from CMIP would be that the forecasts and hindcasts are primarily compared to the observations. In CMIP the forecasts and hindcasts of different GCM models are primarily compared to each other.
In these early stages of this exploration, I’m setting out to evaluate forecasts by others, using some of the criteria that I apply to the performance measurement of my own hindcasts and forecasts. My forecasts can sometimes be very accurate, and so this may seem biased. But I won’t hesitate to praise any who excel in climate forecasting accuracy and transparency of that record. I’ll produce several of these posts, including one on hurricane forecasting performance soon.
Typically for my clients, I publish performance metrics of my forecasts of streamflow and/or temperature metrics for various stream gages. I compare my forecasts and hindcasts directly against observations. I include one or more quantitative performance metrics, such as root mean squared error, correlation coefficient, and often Chi squared or other goodness of fit metric as well.
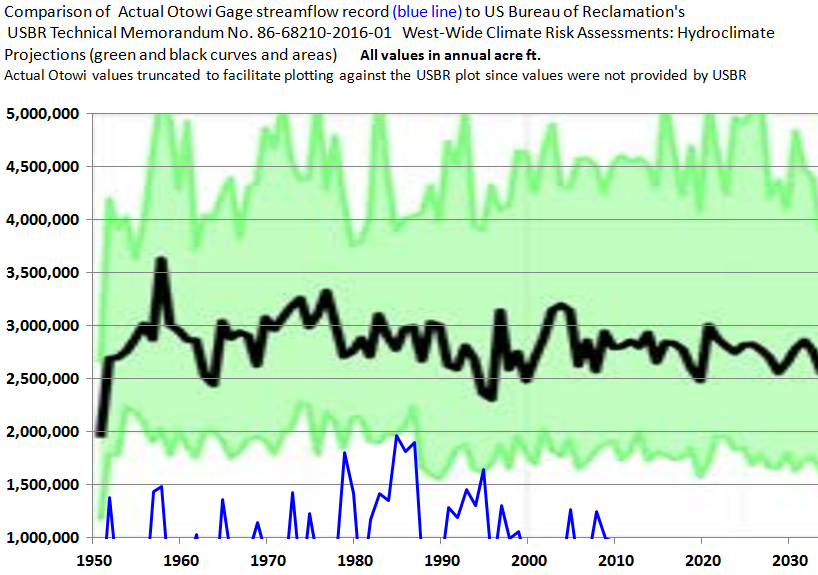
I then attempt to compare those to the performance reporting of forecasts by others. This year I’ve started to evaluate US Bureau of Reclamation (USBR) hydroclimatologic forecasts. I’ve begun with the attached chart for flows of the Upper Rio Grande in North Central New Mexico, which is adapted from Figure 33 of the US Bureau of Reclamation’s Technical Memorandum No. 86-68210-2016-01 West-Wide Climate Risk Assessments: Hydroclimate Projections.
I could not find any performance metrics for this work. It is also clear that their modeled time series of the Otowi gage results don’t include the actual observations for easy and rapid graphic comparison. Accordingly I’ve reached out to a USBR staff expert to confirm that my overlay is correct. Typically in my comparisons I also include the costs of each study, as this is an important concern to customers of climate forecasts in general.
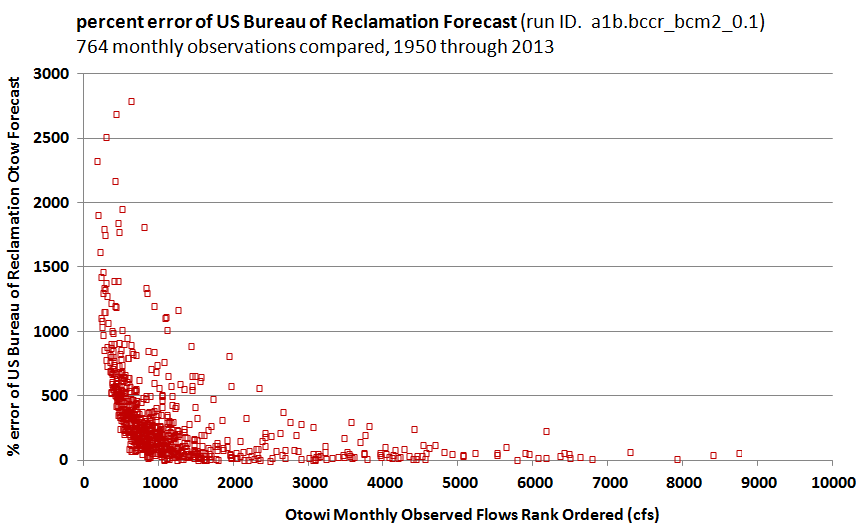
If my overlay is correct then the skill of the USBR projections of the Rio Grande flows is very poor. I was able to access some of their results for a slightly more quantitative evaluation. The following figure appears to be typical of the performance of the more than 100 simulations the USBR developed simply for the one Otowi gage on the Rio Grande in North Central New Mexico. The errors from this perspective support the “very poor” ranking I’ve applied. A majority of the monthly simulation results depart more than 100% from the observed. Many of the month results show errors greater than 1,000%.
The USBR Rio Grande forecast may also have been a costly effort, given the extensive underlying CMIP and VIC based climate modeling work. Perhaps the cost of that analyses is compounded by the potential impacts of the errors in the volumes of water anticipated to be available. Given an average cost of $1000. per acre-foot, and given the rough error of about 2 million acre-feet per year, that translates to a potential added cost of $2B per year. That seems rather large, but the cost per acre is not controversial and nor are the errors in dispute. The West-Wide Climate Assessment is also used as a source of authoritative emissions – based climate information by many other agencies and organizations. Accordingly there may be additional costs that impact all constituents.
Introduction of competition might promote cost reductions and greater accuracy of climate forecasts over the long term. Our company is a new entry which outperforms the established methods. This is in part because we follow best industry practices such as quantitative metrics for disclosure of forecast performance.
Some comparisons between climate forecasts and climate observations may be best facilitated by reproducible guidelines as contained in this white paper we offer for sale at StochAtlas 2017.
If the USBR, as an accountable agency, does make efforts to improve the transparency and the performance of their hydroclimate forecasts, I hope that they will appropriately cite. Outside of this post, there appear to be no other independent papers which have raised attention of the deficiencies at this time.
copyright 2017 Michael Wallace