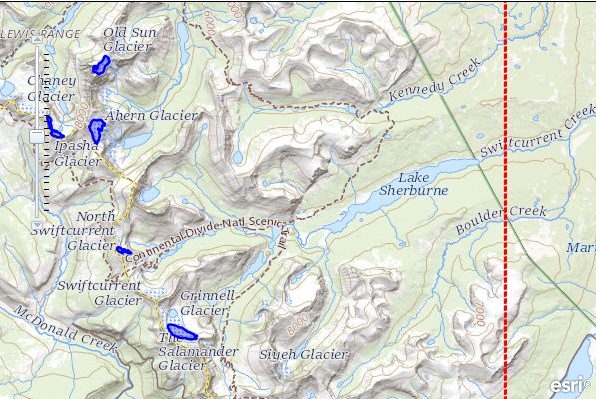
I noted earlier that Glacier National Park (GNP) in Montana, US., was recently directed by the USGS to stop broadcasting through signage that their glaciers would disappear in a few more decades. But as I sift through the data and narratives associated with this, it is clear that dire assertions remain. I want to further test my recent Solar Cycle – Hydroclimatology paper [1] against conventional notions of glacier evolution. I recently visited the underlying USGS resource [2] to that GNP article, so that I might begin to understand what their foundations are for the mixed messaging. I found some interesting material, and among other things that includes the featured image, which their site facilitates nicely. The tiny blue blobs are the glaciers.
At their site, the USGS site makes a compelling case that between around 1966 and 1998, many glaciers there were in decline. They make an equally important case that since that year, the decline of glaciers was arrested. It took them two decades to begin to correct the dire messaging. That’s a long delay even by their standards. In any case their tiny correction continues to be overshadowed by their primary assertion that the world is warming and glaciers accordingly are shrinking everywhere.
Many may be torn between believing in the USGS’s observations or believing in their emissions-based glacier decline narrative instead. Or on the other hand, some could take a closer look even if only nominal. I’m trying that because I’m interested as usual in falsifying my own counter-intuitive notion that Solar-driven geostrophic moisture in turn drives glaciers, and accordingly, temperatures and winds play second-fiddle.
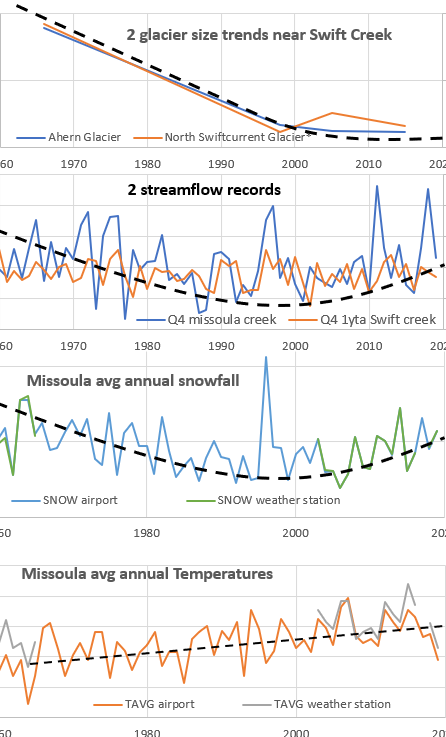
With this in mind, I’ve sampled locally from two glaciers [2], two streams [3], and two weather stations [4] for comparative information. I limited the time frame by the shortest time series (glaciers in this case). From the weather stations I plotted annual temperature, snowfall, and total precipitation. From the streams I plotted annual flow rates. I took the glacier size estimates from the USGS resource. Normally I would apply spreadsheet tools to fix trend lines to the actual data, but for this brief post, I think any can eyeball my placement of the informal dotted black ‘trend’ lines and confirm they capture the basic patterns of each series. Obviously I have no data yet for the final few years of the glacier coverage, but perhaps given that recent news for the park, the areas of some of the glaciers may have actually increased.
This is just a quick trajectory through the data, and so I will limit my descriptions for now to binary types of conditions, such as whether a parameter appears to trend up or down, over specific intervals, and whether any maxima or minima of parameters are shared.
Conventionally it is taken for granted that warmer annual temperatures at Glacier National Park should lead to greater ice melt. The added ice melt itself should then lead to greater streamflows. That is one pattern I searched for in this array of time series, but did not find. Next, more precipitation as snow should be indicated by less glacier ablation, and even growth in a given glacier. That is a second pattern I examined. The chart above supports that notion. Finally more precipitation as snow or rain should be fairly clearly expressed by greater streamflows and that is the third pattern of interest to me. The chart supports this as well.
Note that one stream, Swiftcurrent Creek (Swift Creek on the chart) was selected because it reached into nearby glacier catchments, and the other stream, Blackfoot River near Missoula (just Missoula on the chart) was selected because it did not reach any glaciers (that I know of). This helps in searching for differences that might have originated from glacial storage. It’s a welcome surprise to my own confirmation bias* that the chart suggests that glacier storage did not contribute to the streamflow over the annual average scale used.
Overall, the figures demonstrate that for the period of data, glacier evolution tracks to moisture changes. In contrast, temperature does not appear to track annually with any of the other parameters. Critically to me, after 1998, temperature continued to trend up in that locale even as glaciers stopped shrinking.
Finally it’s interesting that at their resource as I’ve excerpted for the below table, the USGS does not assign a unique year to their Little Ice Age (LIA) column for Montana glaciers. This is only a blog, but the LIA covers about half a millennium according to its arm-waving advocates. 😀 When researchers blend a vague and very large time span with the specific years that follow, the USGS is not meeting their normally high (if not glacially slow) standards. I hope that they will try to add some context and balance. Otherwise some might get an emissions-based warming causation notion confused with a coming-out-of-a-natural-cycle notion. Policy implications as usual can result, when the public doesn’t have candid information.
| Glacier Name – GNP | Area LIA (m2) | Area 1966 (m2) | Area 1998 (m2) | Area 2005 (m2) | Area 2015 (m2) |
|---|
In this post I took a quick comparative look at hydroclimatological candidates which might have driven glacier shrinking and rebounds at Glacier National Park. I found an apparent correlation with moisture but little if any alignment to temperature. That leads me to continue on the notion that moisture drives glacier patterns at many scales, and that temperatures do not.
References
[1] Wallace, M.G., 2019, Application of lagged correlations between solar cycles and hydrosphere components towards sub-decadal forecasts of streamflows in the Western US. Hydrological Sciences Journal, Oxford UK Volume 64 Issue 2. doi: 10.1080/02626667.2019.
[2] USGS 2016. Area of the Named Glaciers of Glacier National Park (GNP) and Flathead National Forest (FNF) including Little Ice Age extent, and years 1966, 1998, 2005 and 2015. https://www.usgs.gov/data-tools/area-named-glaciers-glacier-national-park-gnp-and-flathead-national-forest-fnf-including
[3] USGS 05014500 Swiftcurrent Creek at Many Glacier MT, and USGS 12340000 Blackfoot River near Missoula
[4] NOAA NCDC https://www.ncdc.noaa.gov/cdo-web/
*Like most of us, I have been geared to believe in the conventional view, that a warming planet makes glaciers shrink. The fact that this alternate notion continues to find traction based on some straightforward logic as well as the actual data is a reason I continue to review the data and challenge that bias.