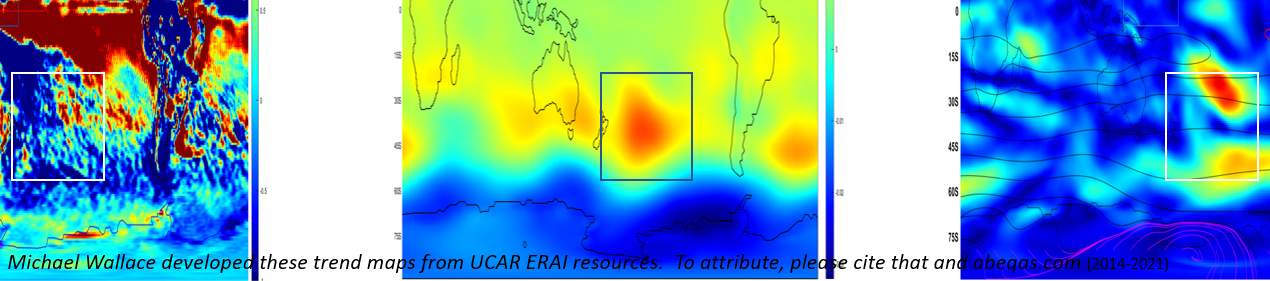
Since 2014 this site has advanced the state of the art for climate analyses including approaches to the study of how it may change. That came from a unique perspective fully rooted in solar seasonal to decadal forcing and the hydrogeostrophic continuum. I am just sharing a fragment of a more collaborative work in progress that carries on this tradition. These three parameters are more than just pretty faces so I’m looking forward to finishing up my part in developing these fully data driven portraits of our planet’s climate.
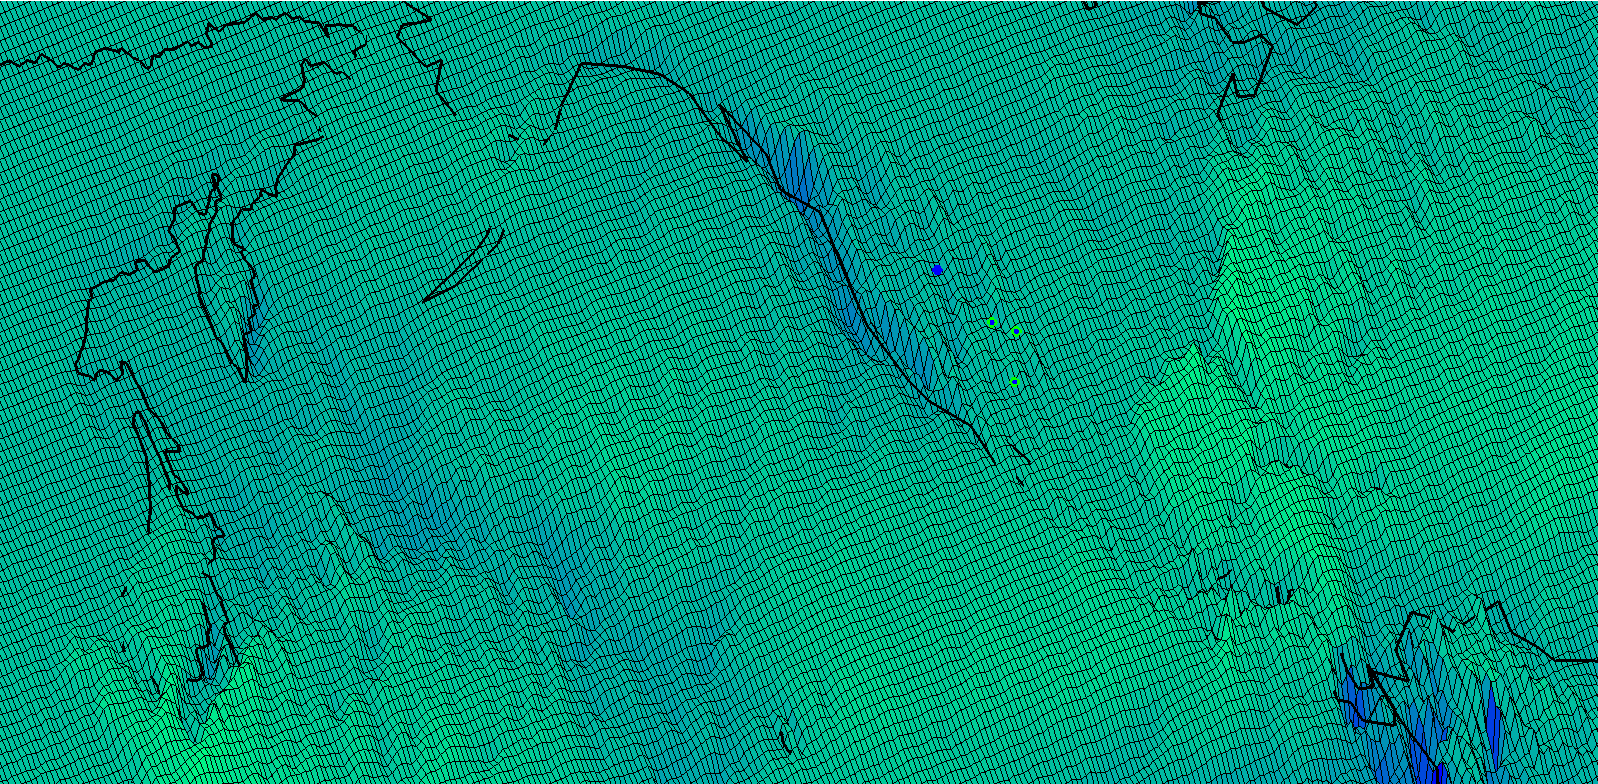
Each frame has numerous precursors at this site. The left frame above captures a trend of atmospheric moisture waves such as the example below.
The middle panel of the top frame has been a focus of recent posts about the long term cooling of Antarctica. That post holds a current record for visits at this site of over 20,000. Not that this signifies my technical cred, but there was that time when a leader of the AMOC movement dismissed part of my work by noting that I had zero Twitter followers. I am new to Twitter but I think it offers a small window for sharing climate and covid concerns and thoughts with and outside of mainstream circles. I know that any credibility comes from other tests.
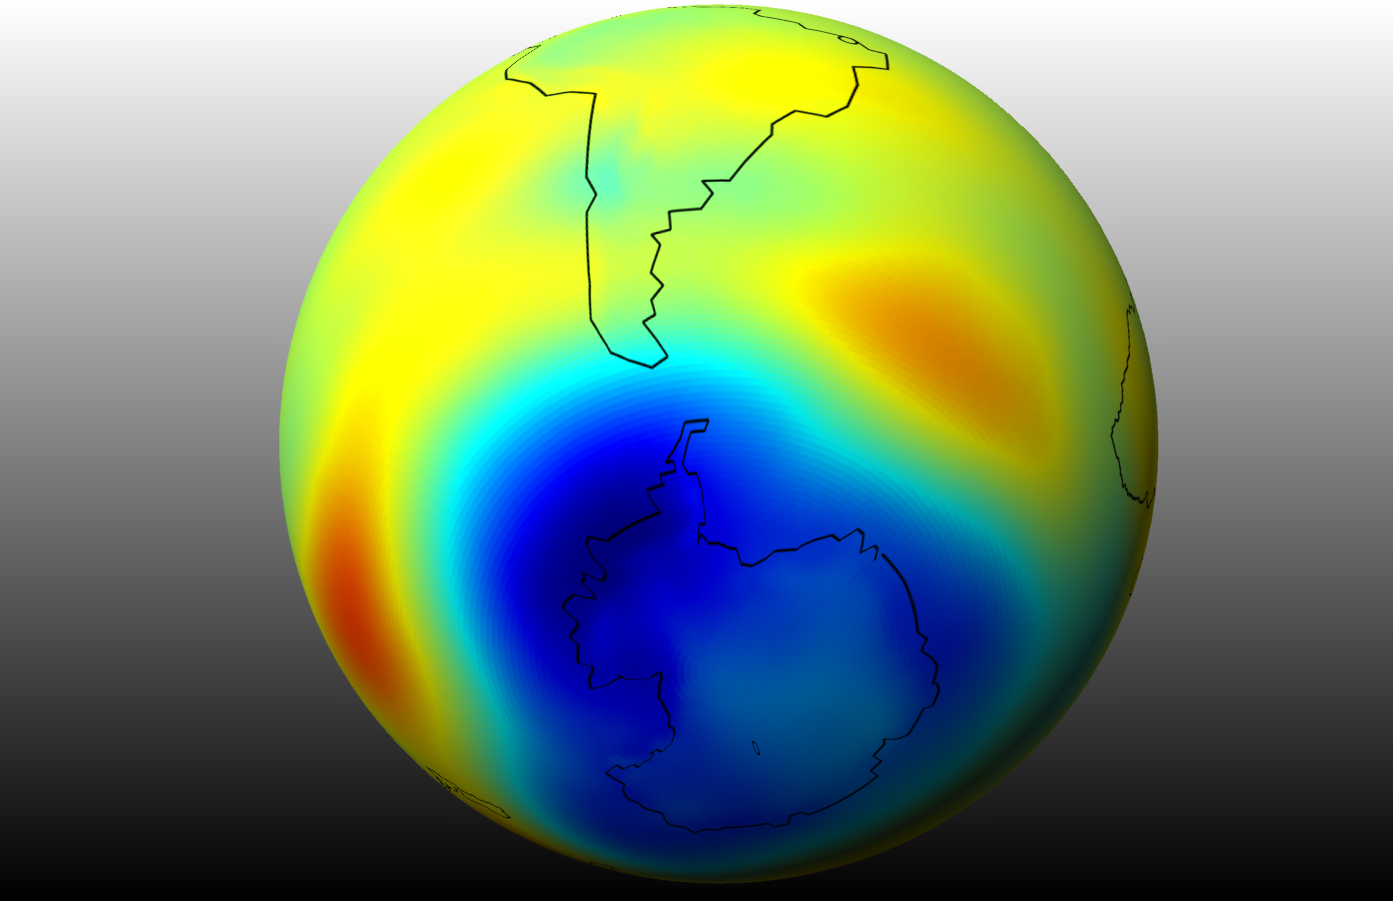
The right panel of the featured image at the top is also from work in progress that may be complementary to the other two. It is a trend of a circulation parameter which this site explores frequently as well. The somewhat related example below included a fanciful molecular overlay relating to water and ozone that is often explored here.
This brief post has shared a few representations of climate trends and the satellite data which support. Modern climate change projections are based on models which are contradicted by the satellite trend evidence. That is not widely disclosed. Accordingly, climate scientists must have other notions of model accuracy and success that are not based on comparisons against actual satellite data. You’d have to ask them what those are.
You’d have to ask water and climate resources professionals why their models are contradicted by Satellite data.
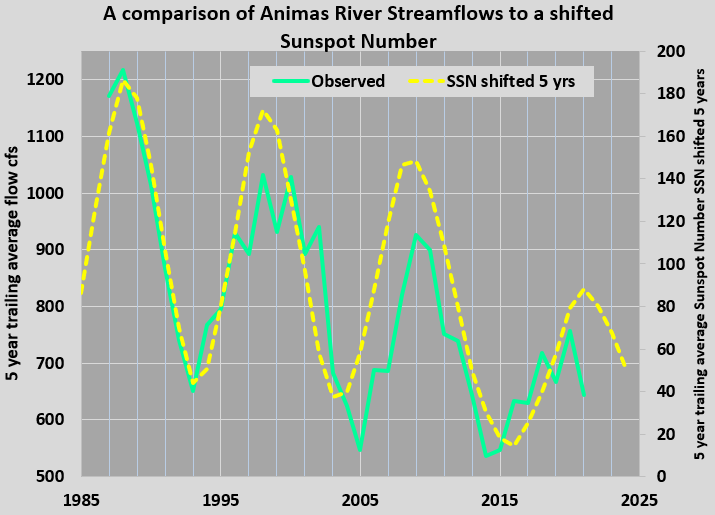
In contrast, where the geostrophic fits are optimal, the methods premiered here can deliver accurate projections, years in advance. Here’s an example of a solar cycle connection to the Animas River within the Southern Rocky Mountains. The forecast that preceded this academic link still ranks as the world’s most accurate long term hydrological and hydroclimatological forecast.
If you are not caught up to the solar-forcing-of-Earth’s climate peer review literature, then you could do worse than to review the abstract of that paper. It will possibly shift your view about climate uncertainty from what you’ve been taught to date. Solar driven climate change projections with that accuracy and fidelity appear to remain unrecognized at most universities and other publicly funded centers of research, as well as at private weather and climate analyses services. Accordingly, if you represent an institution or business with a need for training or consultation in climate science and related projections that are aligned to the best satellite trend data, you’ve come to the right place.