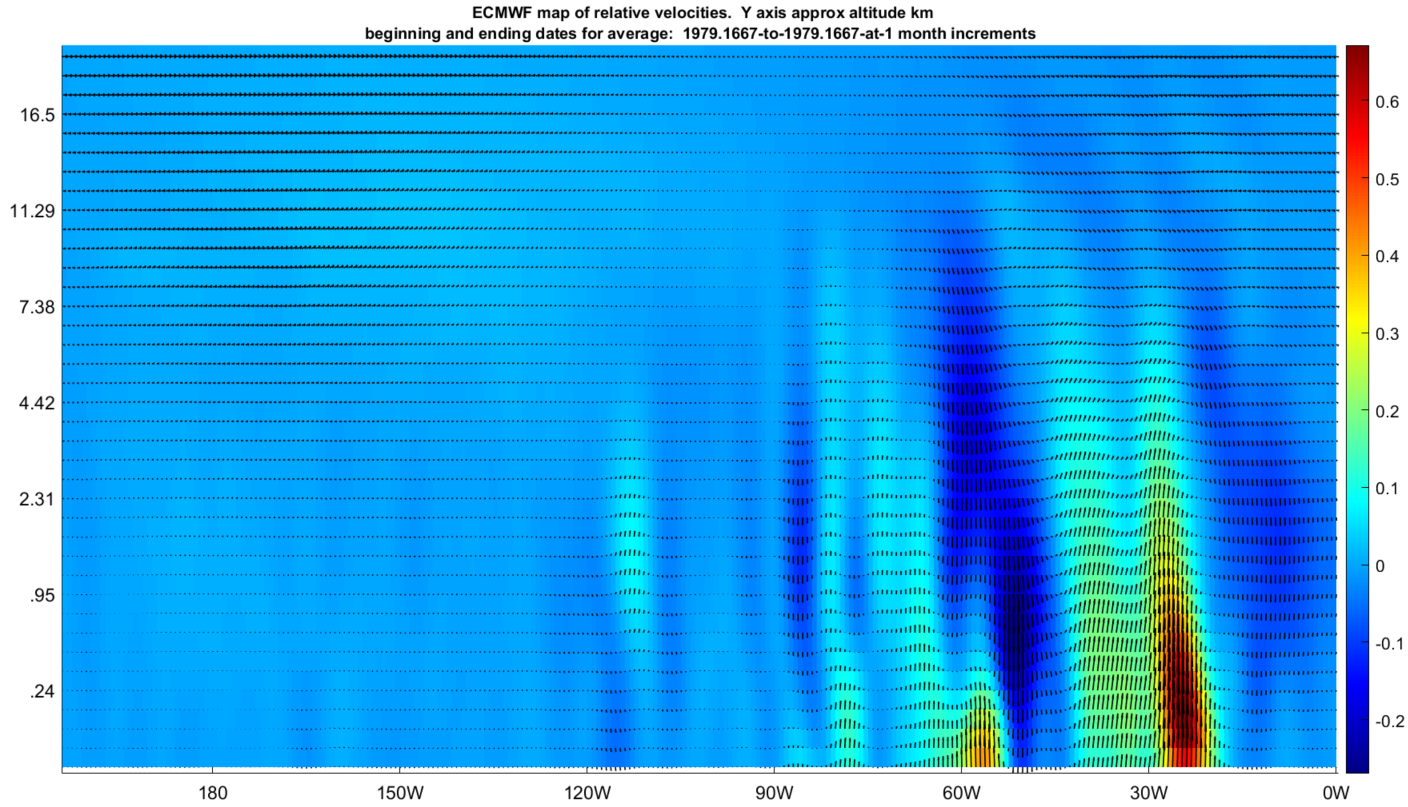
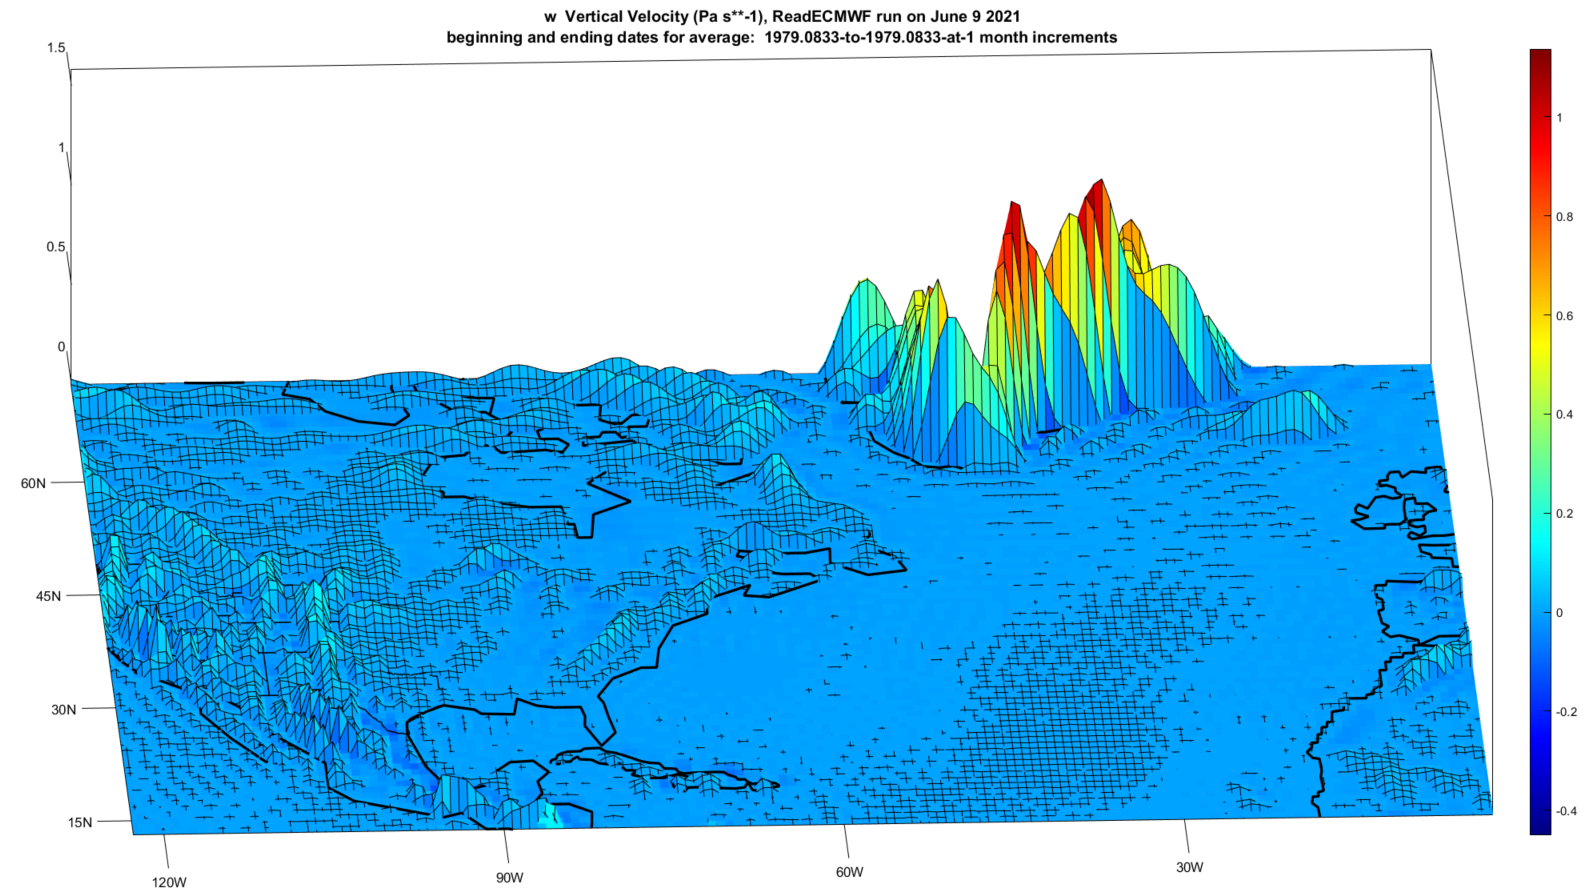
The circulation of energy and mass through our oceans and atmosphere is something to be marveled at and humbled by. I’m easily moved by data based images such as the featured manifold of air along the Arctic circle on January 1979. The dark blue reflects downward moving air and all other colors reflect stable or upward lifting air. The arrows complement, and accordingly one can make out many interesting patterns. Some of those patterns poke holes in many cherished climate-change notions.
This post will revisit images from this site that support. The images are based purely on data. Consider comparing to the largely model-simulation promotions of climate change scientists. Climate change scientists often seem to try to avoid data like the plague. For example, here is an old figure that I like to revisit from time to time.
It was developed by scientists at the Pacific Marine Environmental Laboratory (PMEL) and claims to be a record of historical ocean pH data. I had to file a FOIA to get to the bottom of this (although I never actually got to the bottom yet). Here’s an excerpt from the FOIA I filed in 2013.
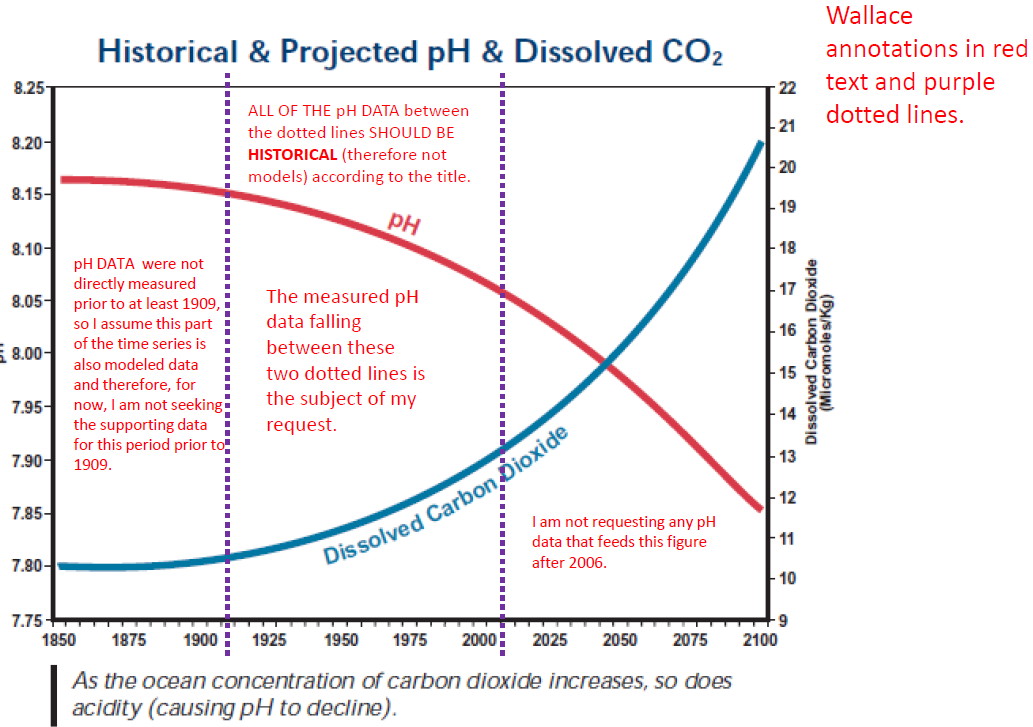
Only after the FOIA intervention did Drs. Feely and Sabine acknowledge that they had omitted actual data and replaced with their wish-fulfillment model. Now a lawsuit from the Center for Biological Diversity, continues to carry that acidified water. If I’m not mistaken, this is the third try for this Center. Meanwhile I’m still waiting for some lawsuits to materialize in the opposite direction.
To refresh the original topic, here are two animations. The first expands upon the top feature image.
The second is another cross section animation of the vertical flows near the Arctic, from Jan through May 1979, but at a slightly more southern latitude.
And for some closure, I’ve more recently mapped the global surface for a few months of that same banner year. These images map the magnitude of vertical winds for January of that year.
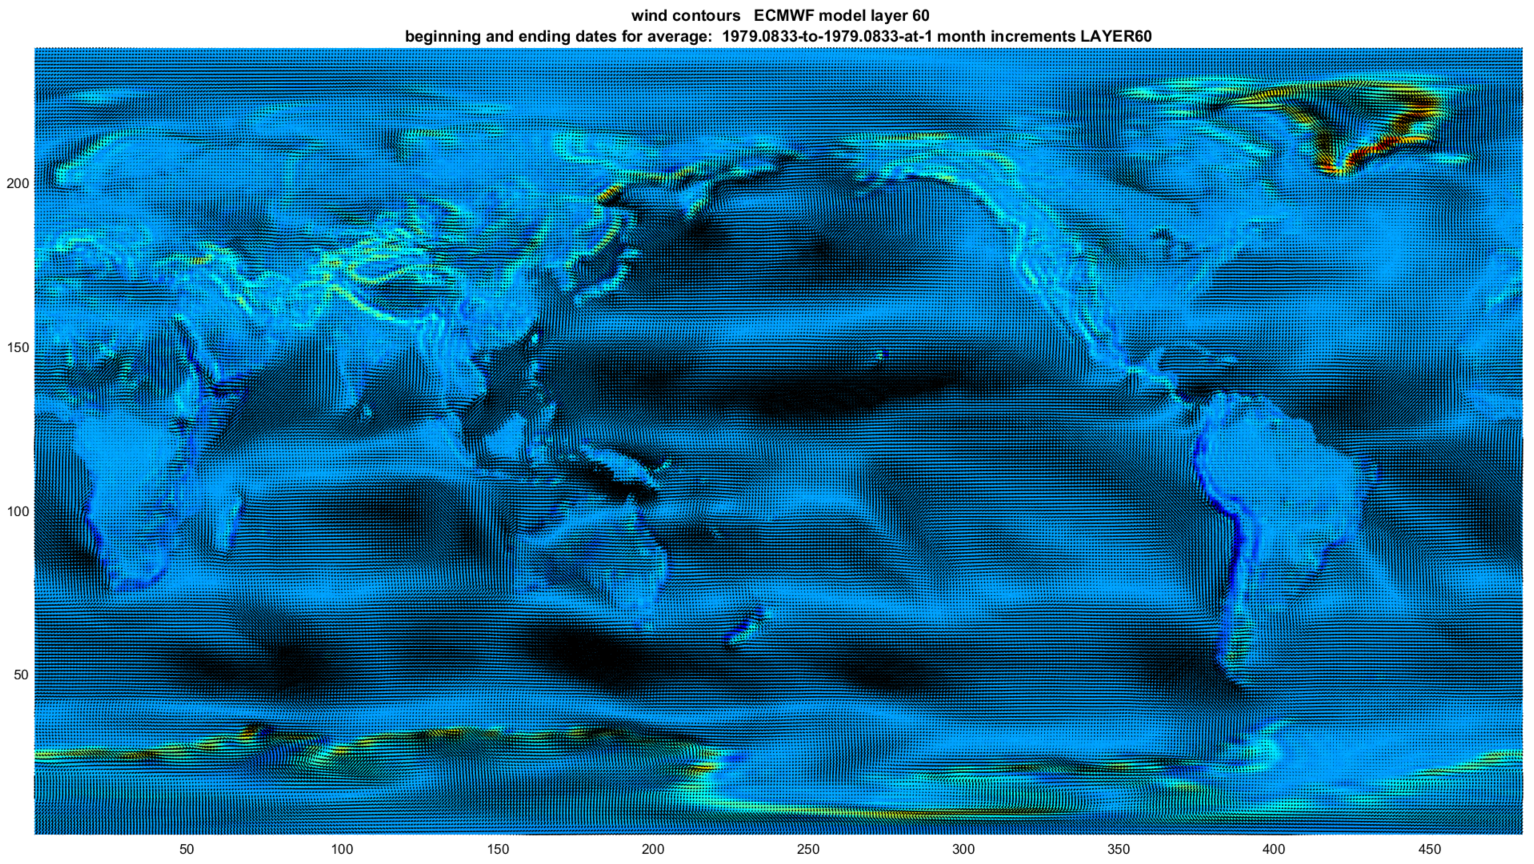
The data is directly derived from the ECMWF. These data representations are therefore real even if still draft, and apparently this perspective is novel. Accordingly please if you share, remember to attribute abeqas.com or myself. Seeing any flame-like patterns in the initial images? I’d guess that the Boundary Layer and perhaps global climate-change-ology will never again be seen in the same light.
I’m just exploring these coupled threads of data and models (and legal manifestations) in a bloglike way this week, so I’ll continue to add to this and revise as is my custom.