Volcanism, Climate and Geostrophic Circulation
I will address this topic based on my atmospheric circulation research along with my past contributions in aspects of probabilistic volcanic hazard analyses (PVHA)* and the modeling of atmospheric transport of tephra.
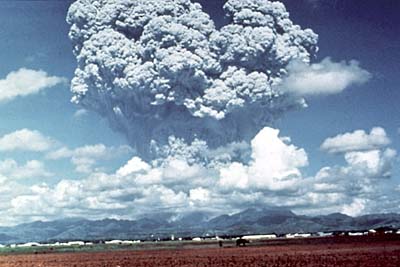
To start, I’ve elected to review two of the more closely observed volcanic eruptions of the satellite era, Mount Pinatubo in the Phillipines (June, 1991, see featured image) and El Chichón in south central Mexico (March-April, 1982). As related by Dr. Alan Robock (2000) [1]:
“Although El Chichón (17°N) and Pinatubo (15°N) are separated by only 2° of latitude, their clouds, after only one circuit of the globe, ended up separated by 15° of latitude, with the Pinatubo cloud straddling the equator … and the El Chichón cloud extending approximately from the equator to 30°N..”
Because much of the initial “action” takes place over only a few days, my current limit of geostrophic time series to monthly resolution is not expected to capture the plume movements with high fidelity, I’ve taken some initial looks however, and the narrative above is consistent with the geostrophic flow patterns. Based on such earlier posts as Geostrophic Streamflows, it would be a valid starting point to indicate that the El Chichón eruption occurred in a region of climatologically divergent flow. In other words, that area is associated with the West Atlantic subtropical (Capricorn) Gyre (WACG), which (when averaged over years) defines the divergence of atmospheric flow away from the narrow easterlies of the equatorial band and “up” towards the north and its dominant westerlies.
That divergence might explain the “El Chichón cloud extending approximately from the equator to 30°N..”
Perhaps geostrophic circulation patterns can accordingly explain the opposite patterns of the Pinatubo eruption. The Pinatubo location occurred near the West Pacific subtropical (Capricorn again) Gyre (WPCG). In opposition to its Atlantic counterpart, the WPCG defines convergence of flows from normally westerly midlatitude flows south towards the easterly flowing equatorial band. To risk redundancy, that convergence might naturally explain the “Pinatubo cloud straddling the equator”.
Therefore, from a geostrophical perspective, it would not be unexpected if one flow spread to the north while the other converged to a narrow equatorial region. Looking even further north, the Mt. St. Helens eruption of May, 1980 is also of interest. I’ve produced a preliminary series of streamlines for the key month of each eruption. I’ve included the streamlines I originate from each volcano regardless of where the actual eruption is from. I do this as a way to provide additional context and to explore the variability of QG flow regimes for each month of concern. I’ve included a fourth image for an average of all of the months in my series, spanning about a quarter of a century. From that image one can see that the tropical volcanoes lie within their respective gyres and the northern volcano is well within the mid latitude westerlies. Yet as the other images show, there is extensive variation from month to month. Also note the streamlines are automatically calculated by the Matlab routines I employ, with no regard to the actual length of time. Typically, zonal winds circle the earth in a matter of a few weeks.
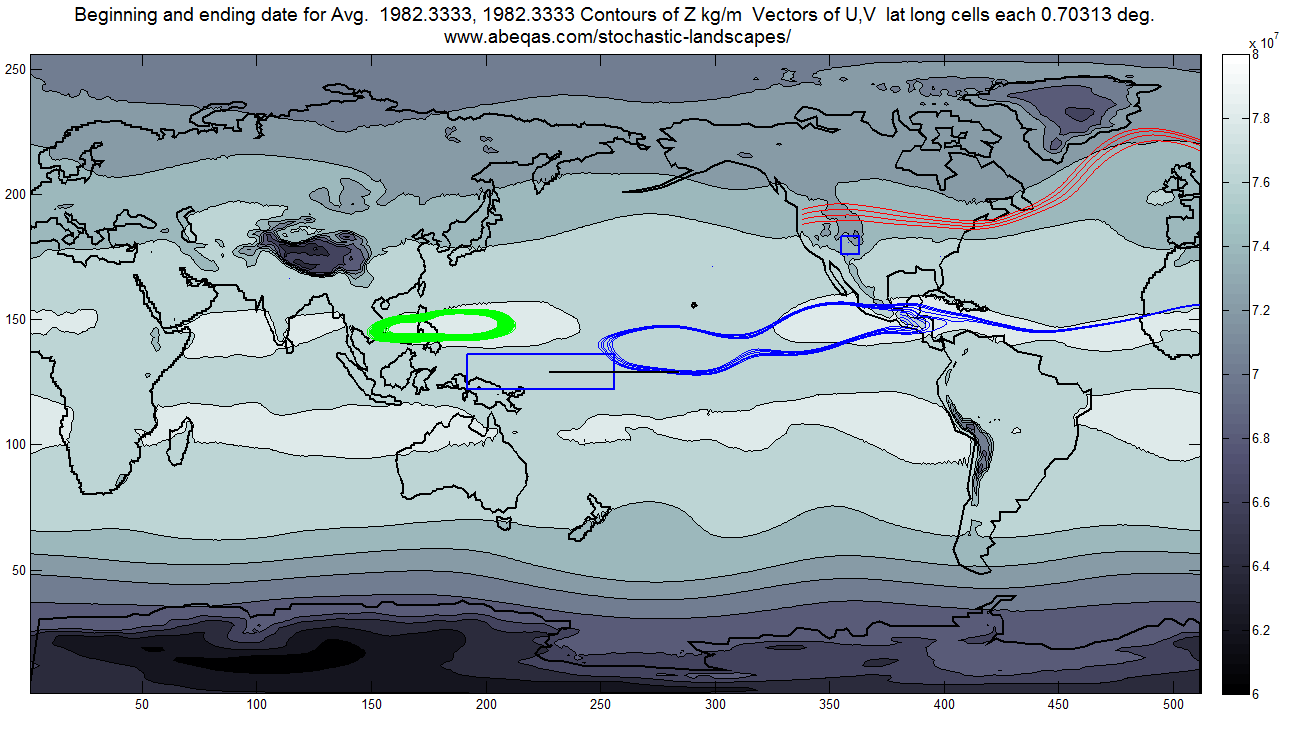
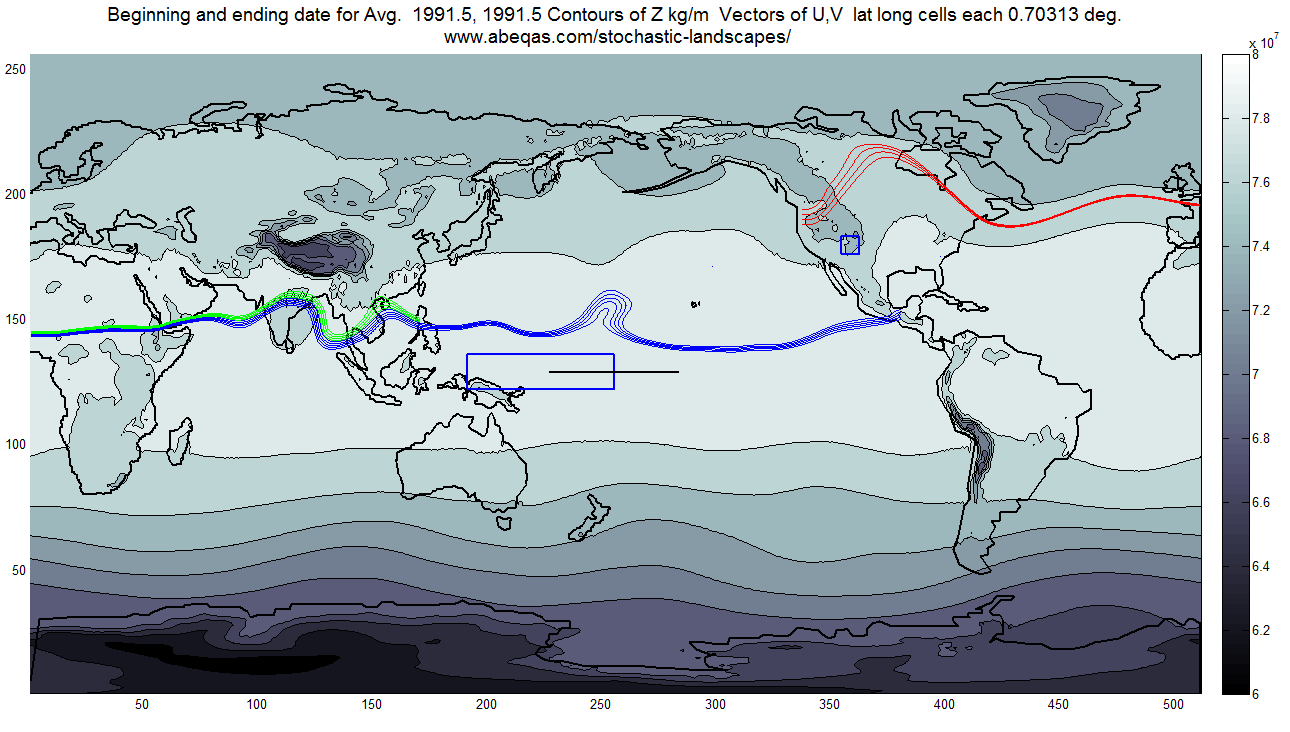 Pinatubo. Green streamlines indicate the plume is captured by convergent equatorial easterlies.
El Chichón. Blue streamlines indicate the plume’s trajectory as more dispersive, and gyre – influenced.
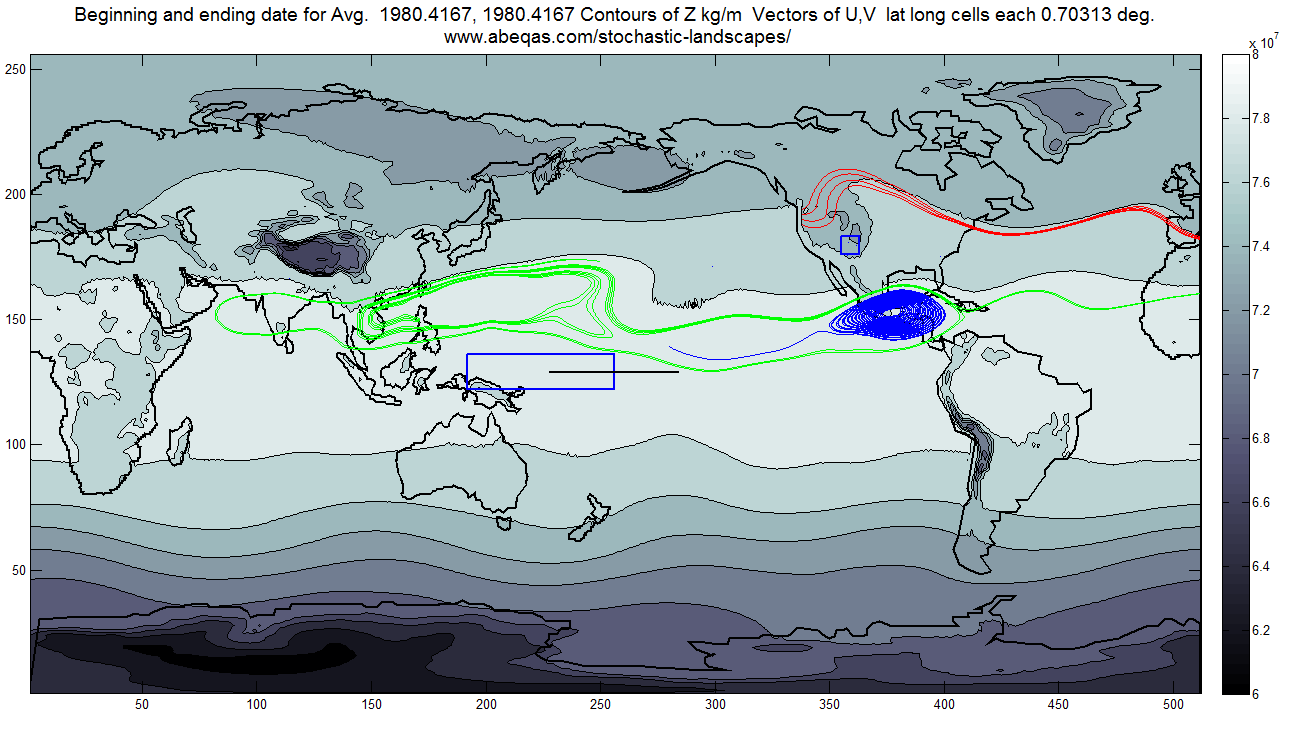
Mt. St. Helens. Red streamlines indicate a dispersive start and convergence to the classic polar vortex (also roughly synonymous with the westerly Jet Stream)
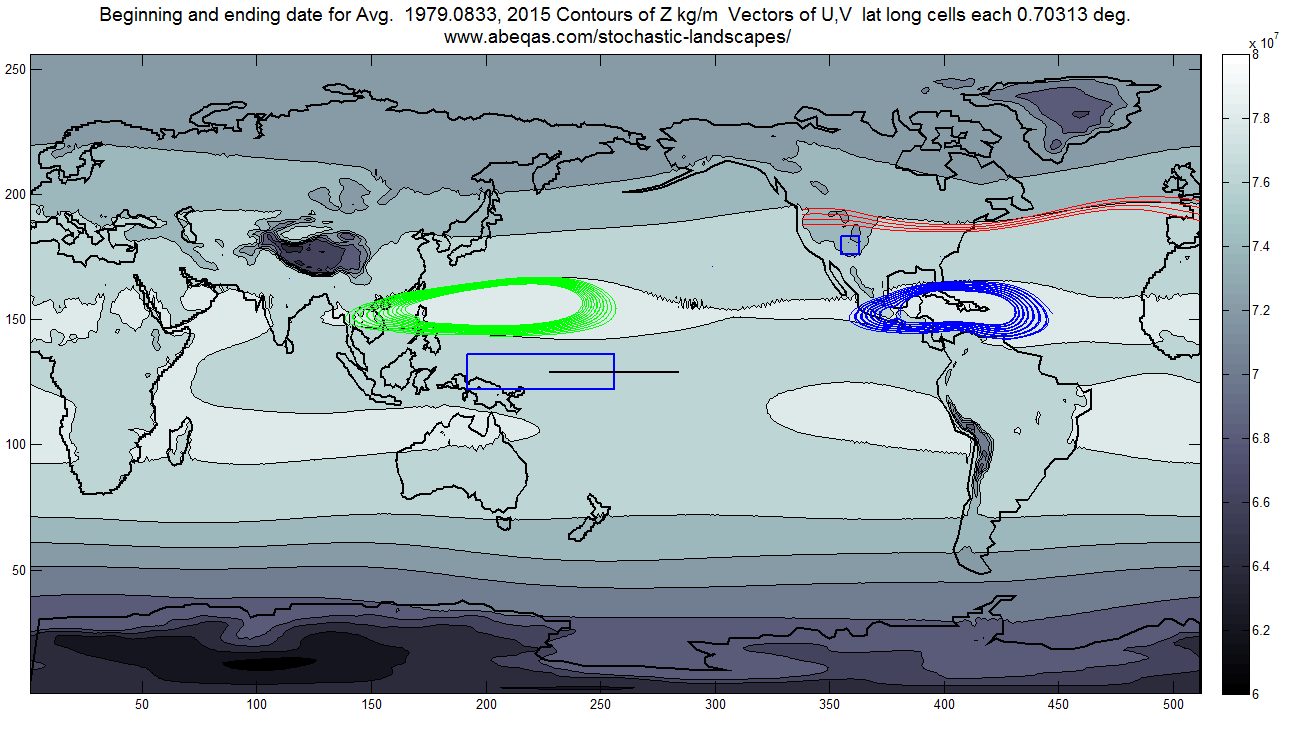
All months of ERAI data from Jan 1979 through December 2014. The average streamlines are shown for the 3 volcano positions as starting points. El Chichón in blue is embedded within the divergent WACG. Pinatubo is embedded within the convergent WPCG. Mt. St. Helens is embedded within the mid latitude westerlies.
The next images are adapted from https://denali.gsfc.nasa.gov/research/so2/n7_17jun91_set3_scene_scene_bbg.gif
They compare fairly well to the streamline images for the respective eruptions, especially considering they cover a smaller time scale and that the QG streamlines cannot capture meridional overturning.
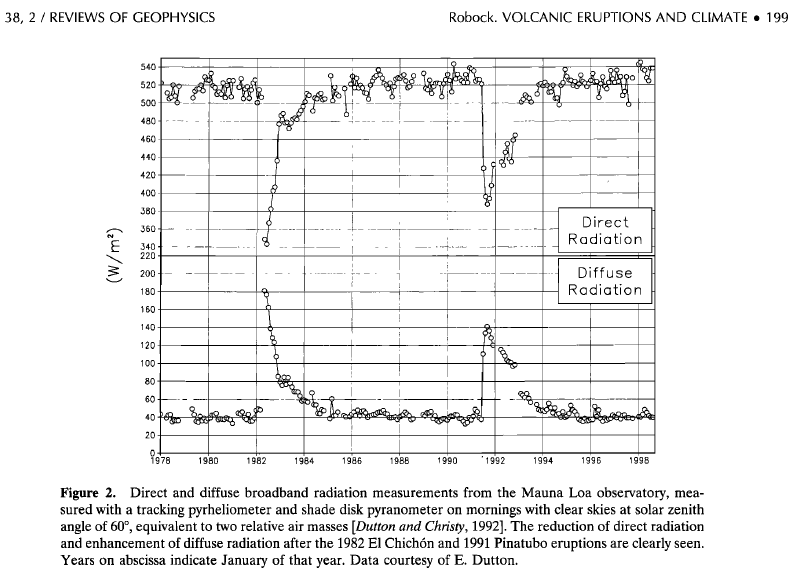
Detailed reading of Robock is consistent more or less with the observations for streamlines emerging from Pinatubo and Chichón. Figure 2 of that paper, reproduced below, shows for example a greater impact over Hawaii of the El Chichón eruption in comparison to the Pinatubo eruption. There is no recorded observed impact in Hawaii from the Mt. St. Helens eruption.
In later posts, I’ll explore:
- The chemistry of volcanic products in the upper atmosphere and relations to ozone and radiative forcing, from a geostrophic perspective.
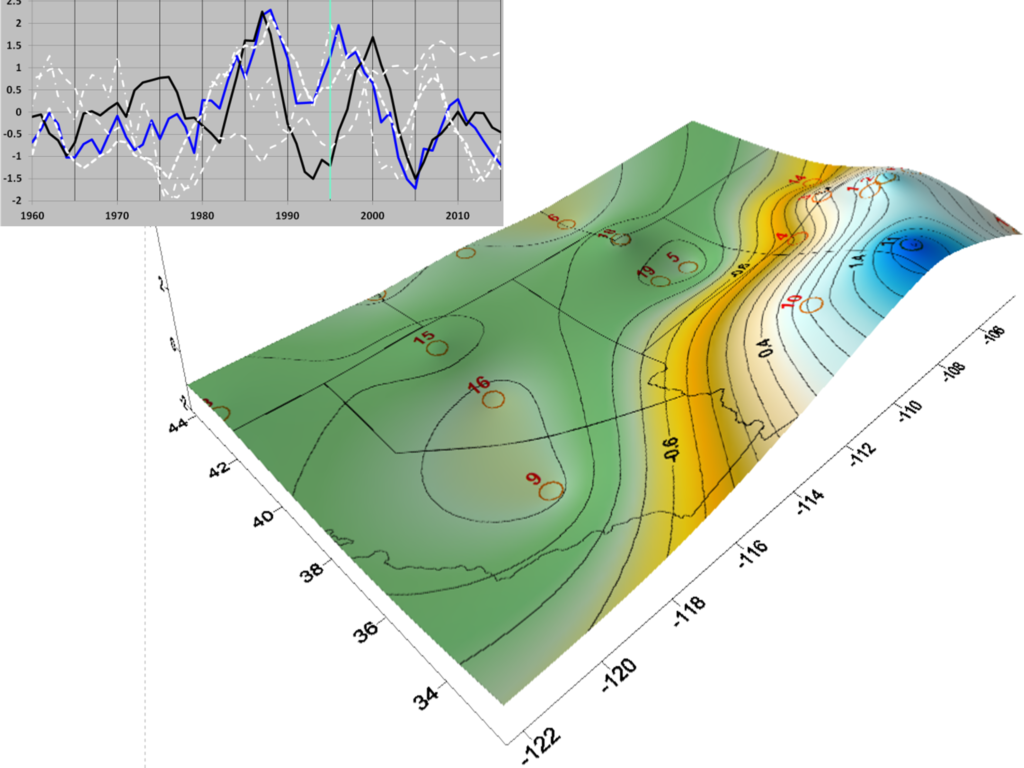
- The signatures of volcanic eruptions in climate representations such as temperature and moisture at synoptic scales.
[1] Robock, Alan, 2000, “Volcanic eruptions and climate” Reviews of Geophysics, 38, 2
* Including an award winning investigation. Search the linked page for “serious games” award near bottom.
 3710total visits,1visits today