
In further exploring the Solar River as an inspiration I continue to roll across interesting patterns. Many of the featured images are repeated from part 2 of this series. They were geared towards the Southern Rocky Mountains (SRM). The initial images cover three snapshots in time of the relative magnitudes of streamflows based on the (60 month averages of the) selected record locations across the Western US, as the insets demonstrate. Because of the selection of representative USGS stream gage sites, along with the 60 month average filter, droughts are possible to infer from each image and its inset. The color field coated surface maps for example illustrate part of a sampling of major streams from the Snake River in Idaho through to the lower Pecos River in SE New Mexico. In the featured image, covering a period from 1990 through 1994, New Mexico is lifted into a higher hydrospheric state during the 60 month period, on average, in comparison to the remaining regions. In the 60 month period from 1980 through 1984, the image below indicates the wettest region occupies the northern to central region. In the third image of this 60 month series, for the period from 2000 through 2004 all values are relatively low.
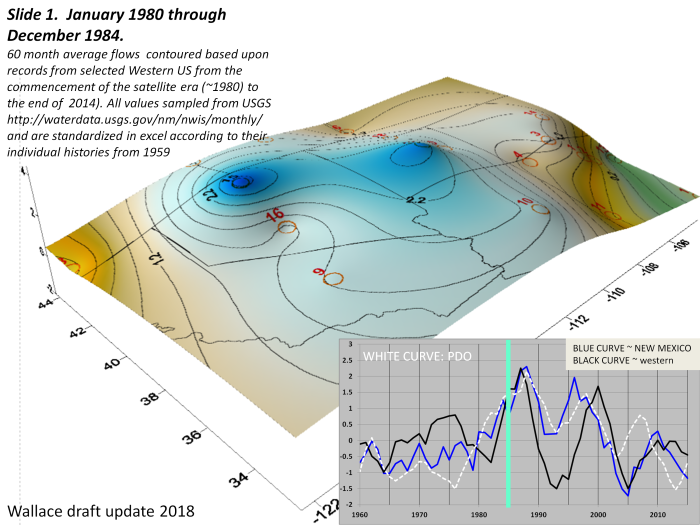
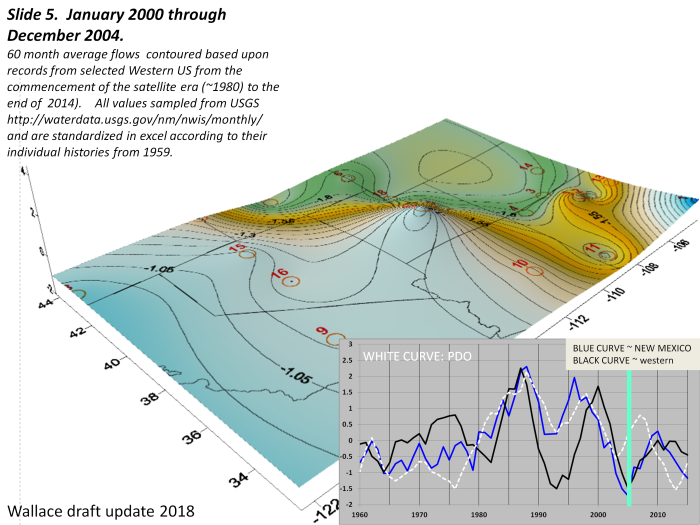
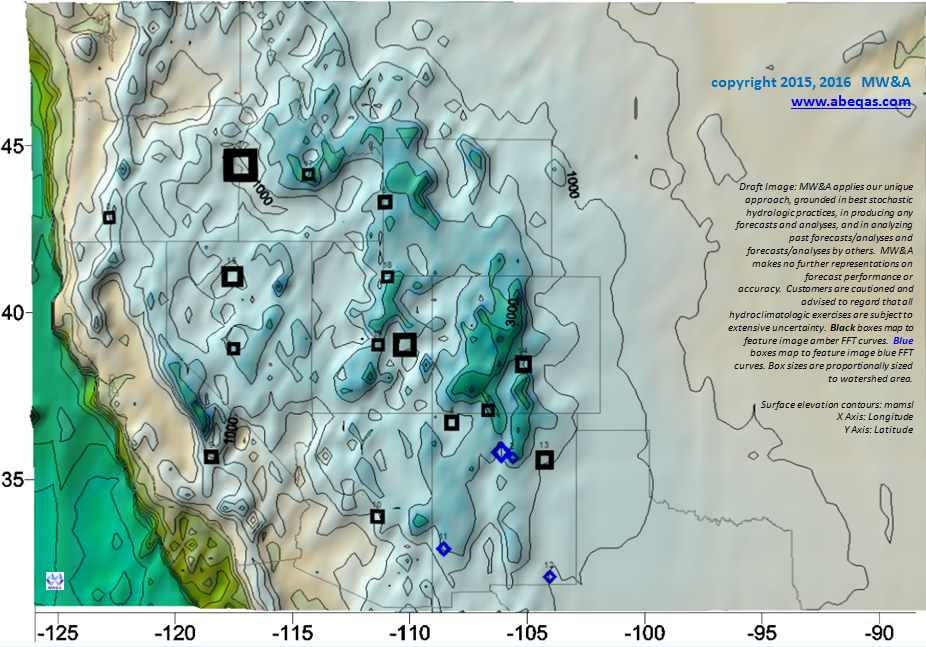
The vertical green lines of the insets for each inset provide the periods of time at which the trailing 60 month average values were developed for each image. The associated curves include the PDO in white (for most cases.. these are draft images). The black lines are averages for the gages shown by open black squares in the map below, which the blue time sereis are averages for the gages shown by open blue diamonds in the same mape.
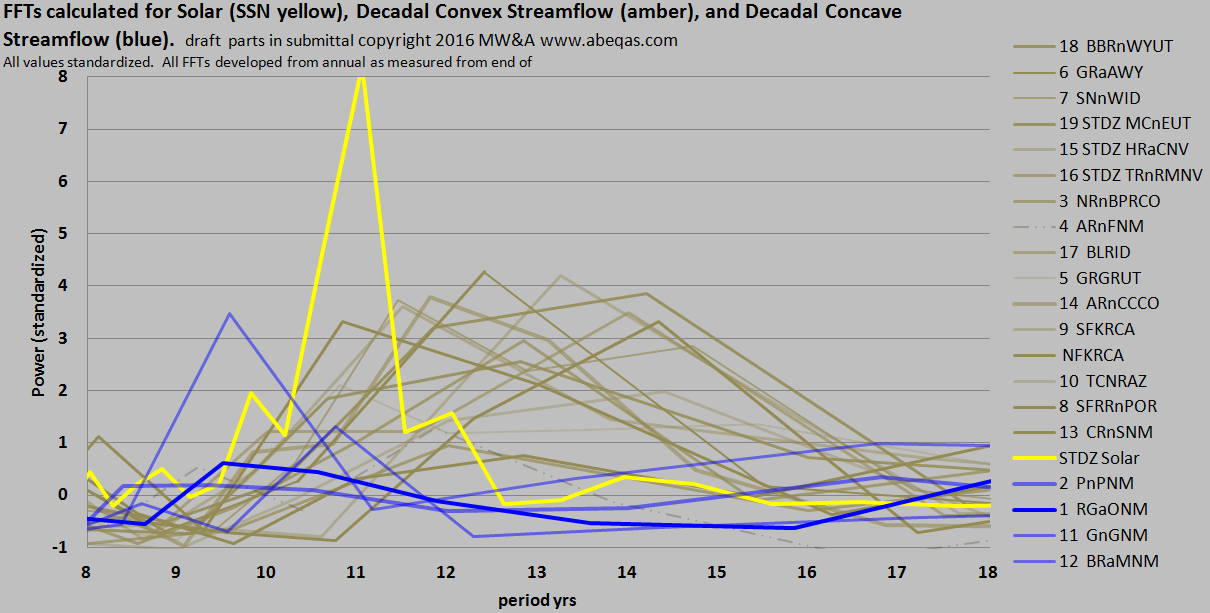
The temporary and/or intermittent phase shift between the largely New Mexico gages in blue, clearly is of practical interest. Accordingly, I had developed some spectral analyses products that factored into the development of my most current published hydrological research. The following chart summarizes some of this preliminary work and demonstrates how the featured stream histories appear to diverge somewhat symmetrically in this phase space from a solar dominated spectral anchor (yellow curve).
This website includes many examples where I’ve linked a sampling of these states to precursor oscillations and have used those to forecast future streamflows in targeted regions. The solar notion is invoked here as before because a possibly enhanced solar precursor signal to surface hydrologic time series can sometimes be found to assist the exercise. Many posts at this site, along with the new paper in the HSJ, explore in more detail.