Accuracy Continues for 6 Year Streamflow Forecast Made in 2015
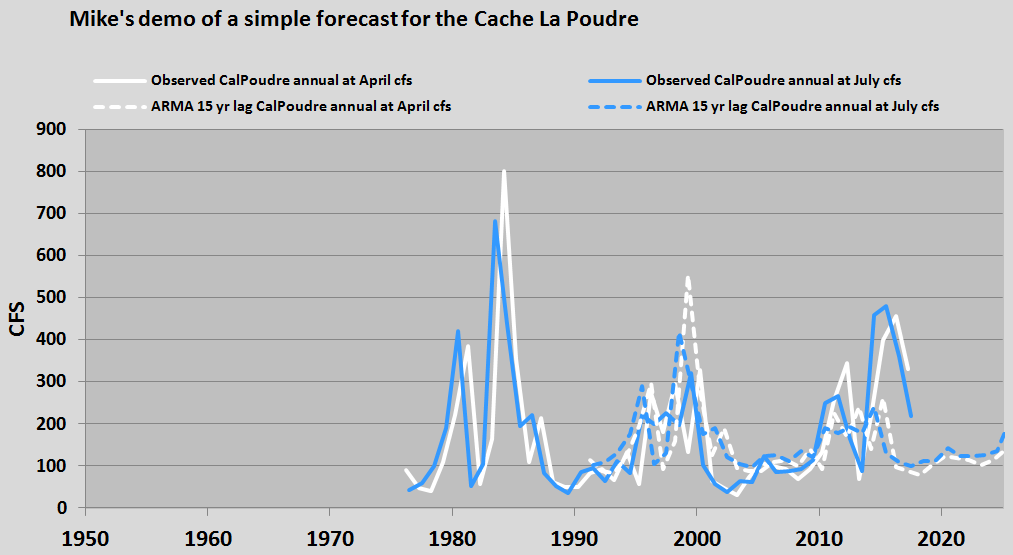
My first paying customer for the hydrological forecasts which deploy the method of [1] was the Water Division for the City of Santa Fe, New Mexico. The featured animation says it all, I think, but I’m happy to provide some supporting text and more. The open blue circles represent the forecast. The solid green line represents the observation record. As detailed in [1], a training period up through the start of 2016, was first applied to a related stream to test the goodness of fit of the proposed cross – regression moving average (CRMA) prediction method. The real forecast begins to the right of the vertical black line.
Note that the forecast is for a typical 5 year trailing average (yta). Accordingly this type of forecast, when it “works”, is more ideal for multiyear planning than for short term applications. The final forecast extends for 6 years after the training period. It provided estimates for the 60-month average streamflow for 6 six years into the future. The forecast is based on both Solar Cycles and an intermediate parameter associated with the western equatorial Pacific. [1]
Now that approximately 4 years have passed, this is a good time to look back. As I was working on this forecast, there had been a long term decline in streamflows in the region going back to 2010 (as the featured image also illustrates). So, the accurate prediction I developed went against the trend of that time. Imagine the celebrity and credibility I would have achieved if I was predicting the stock market, ha ha.
I remain mindful of the autoregression approach (ARMA) along with three major hydrology memes taking up most of the climate news bandwidth in our area at this time: Megadroughts, Massive Tree Mortality, and the Early Spring. The Solar driver is now proven out to some extent by the fidelity of its forecast, regardless of the moving average magnitude. None of the other memes are proven however, even after more than half a decade of assertions and public funding.
In any case my meme advances only because of accuracy. I’ve approximated the remaining month based on the average climatology. Even as I write these supplemental notes, snow is falling thickly in Albuquerque on this Thanksgiving Day. I think accordingly, my forecast will turn out to be somewhat more accurate still for this 2020 milestone.
Also the accuracy for the remaining few years remains to be determined before I can claim a somewhat more complete success. This remaining time should be interesting because the forecast suggests that a peak in flow rate (again, given a 60-month average) is anticipated between now and the end of the prediction span in 2020.
If such a peak fails to materialize, this would be a serious challenge to my application. I don’t think it would pose any great challenge to the overall approach. Solar cycles still play out in stream flow signatures everywhere, but the utility of this particular CRMA application would be naturally found wanting. Readers know what is at stake, because of this very transparency. So again, these Solar cycle based forecasts are subject to a performance evaluation. In contrast, the greenhouse gas emissions-based Early Spring, Megadrought, and Massive Tree Mortality memes are not subject to performance measures or any other critical challenge.
draft
[1] Wallace, M.G., 2019, Application of lagged correlations between solar cycles and hydrosphere components towards sub-decadal forecasts of streamflows in the Western US. Hydrological Sciences Journal, Oxford UK Volume 64 Issue 2. doi: 10.1080/02626667.2019.
 5859total visits,2visits today