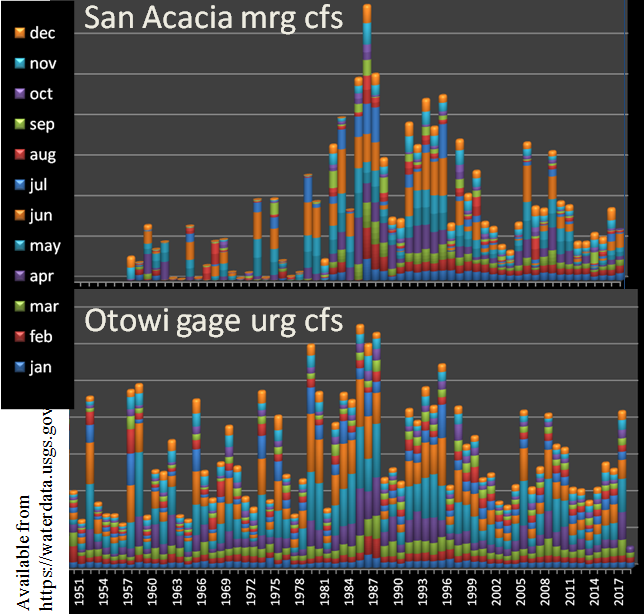
The San Acacia Gage lies along the Rio Grande near Socorro in the central quadrant of New Mexico. Its monthly time series patterns are profiled in the subject image and compared directly to the Otowi gage record several hundreds of miles upstream. I’ve kept the actual scales out of the diagrams for now. Any can reproduce from the cited USGS source.
This region is documented to have experienced high sediment deposition events from major past floods which literally buried the Rio Grande in places. Such burials are interesting because although based on high water flows (flood events), they lead to a subsequent low flow record often purely due to the burial and having little further to do with ongoing climate conditions. Accordingly researchers sometimes employ reproducible techniques to best support water delivery objectives.
One could review the San Acacia image for February in red bar bands for example, and possibly find that the trends if any of that series don’t support the notion of an early spring. The oscillations do appear to relate to the Otowi record. That record in spite of upstream reservoirs and irrigation diversions, has been shown to relate to other ocean drivers, as I and others have written about.
For those interested in learning more I recommend the following reference regarding the upstream contributions to flows at both gauges:
https://pubs.usgs.gov/fs/2003/0110/report.pdf
The map shows that the river is a losing stream just to the north. The related sediment transport processes across the same domain are featured in past papers such as
https://www.fort.usgs.gov/sites/default/files/products/publications/23068/23068.pdf
This 2004 USBR – USGS study indicates that “Data from two periods, 1972 through 1992 and 1992 through 2002, were available to develop calibration parameters for the predictive model using historical hydrology and cross-section geometry”
Through review of such papers and especially review of the featured time series, one might as I have, identify a perhaps important division between low and high flows. This division can also be supported by the Otowi time series. In this alternate conceptualization the primary low flow period at San Acacia is evident from 1960 through 1981. The primary high flow period is all time since then to now. On the other hand, the first period described is punctuated with high flow and flooding events. Without further information it would be precarious to speculate further.
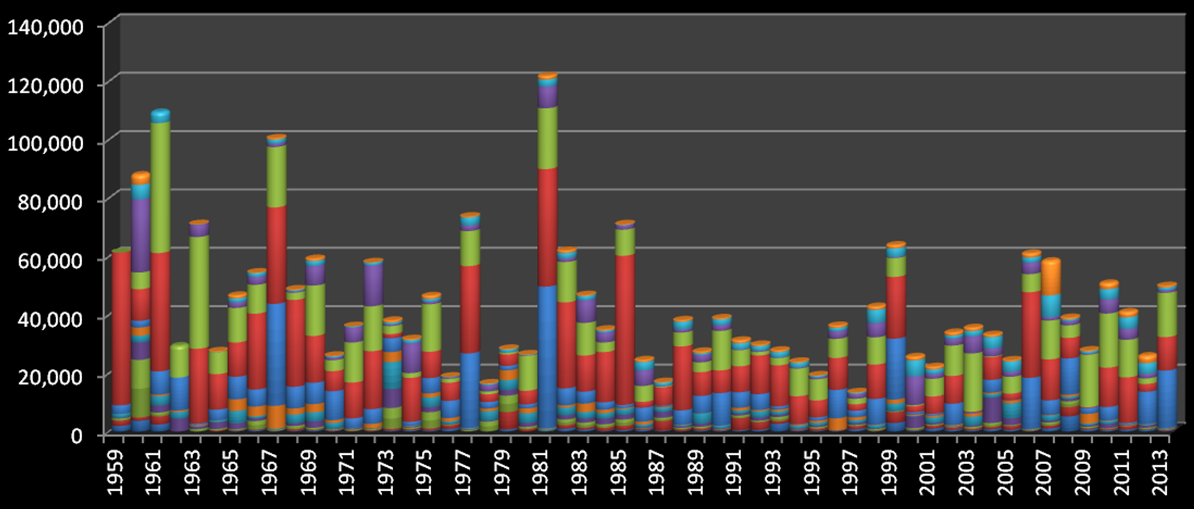
It is no surprise then from the above USBR-USGS study that the suspended sediment load history in mg/l has also been captured by the USGS at this gage. I’ve downloaded and charted in the following figure. The sediment record is found to be dominated by mid to late summer storms. It is always an interesting enterprise to merge sediment histories with overall climate histories with this summer seasonal dominant feature in mind.
Given the San Acacia record’s similarity to other streams of New Mexico that I research, I will continue to integrate into my stochastic maps. I’ll also try to stay mindful of the signature footprint of the sediment record. I will assume as I usually do however, that the channel at the gage site was never impacted substantially by any burial condition (if any).
The same cannot always appear to be said for its companion gage in San Marcial. I find a paper by Gorbach (1999) to be somewhat informative regarding these featured gages and the Low Flow channel which connects San Acacia to Elephant Butte Reservoir more than 50 miles further downsteam.
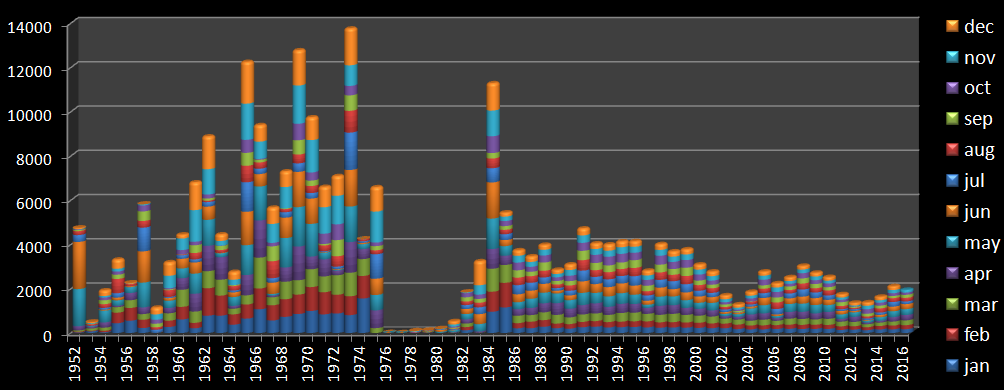
According to Gorbach, the San Marcial gage is known to be jointly impacted by numerous factors and conditions. The last image is a streamflow record in cfs for that gage for further evaluation and enjoyment, somewhat like train-spotting. I enjoyed:
- The signature of the first half of the time series followed by and or including
- the extreme low flow (or missing?) record bottoming out in the late 1970s and
- the continued yet dampened oscillatory signature also seen in the Otowi and the San Acacia Post 1979, which also has been connected to the PDO signature. I can only speculate until I learn more, that this third span is a consequence in part or in full of the low-flow conveyance channel (see Gorbach 1999) and that this more closely reflects Otowi gage record than for the example the Gila record near Gila, NM.
Some references
Gorbach, Chris. 1999. History and signficance of the Low-Flow Conveyance Channel: What is its future? New Mexico Water Resources Research Institute (WRRI) annual conference theme “The Rio Grande Compat: It’s the Law!”