I’m looking at waters of the United States to help me to better understand the united states of Water. Whether water circulates around the planet as ice particles, liquid droplets, and/or in the vapor state, their net effect across any given continent is always stunning.
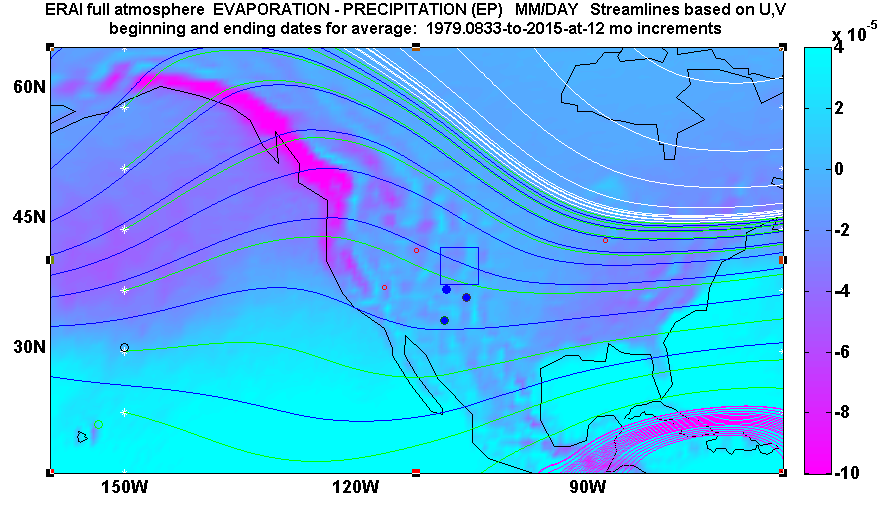
This animation covers only 4 seasonal months, but is a more detailed and targeted look at the full 12-month geostrophic monthly global moisture. In this blocky rendering, the greater the concentration of magenta in the hue, the greater the relative amount of precipitation. Towards the other extreme, the greater the light cyan blue color, the greater the relative amount of evaporation.
Each of the four frames is a season’s middle month; January, April, July, and October. In July*, the North American Monsoon (NAM) ‘lights up’ much of the continent, even as it douses New Mexico and surrounding domains. The simultaneous summer retreat of the magenta band from North America’s Pacific Northwest is another striking feature, which in that case indicates the onset of their dry season.
The blue box within the Rocky Mountain region is not Colorado but rather an overlapping watershed study favorite of mine. The solid blue dots represent study focus areas for a recent paper (Wallace, 2019) on correlations between New Mexico streams and solar cycles.
Confirm your climate?
Keeping in mind that this animation is only 4 frames, each corresponding to a season, I think your seasonal perception of your local weather will be confirmed from occasional viewing of the repeating series. If you don’t live in North America, try the full animation already linked above (it is also smoother and easier on the eyes).
Data source
UCAR ERAI Source: Available from http://www.cgd.ucar.edu/cas/catalog/newbudgets/index.html#ERBEFs
Reference
Wallace, M.G., 2019, Application of lagged correlations between solar cycles and hydrosphere components towards sub-decadal forecasts of streamflows in the Western US. Hydrological Sciences Journal, Oxford UK Volume 64 Issue 2. doi: 10.1080/02626667.2019.
* July is the frame with the .5833 stage in the title, because this is the fraction of a year that is achieved by July 1