The QG Intertropical Convergence Zone (ITCZ)
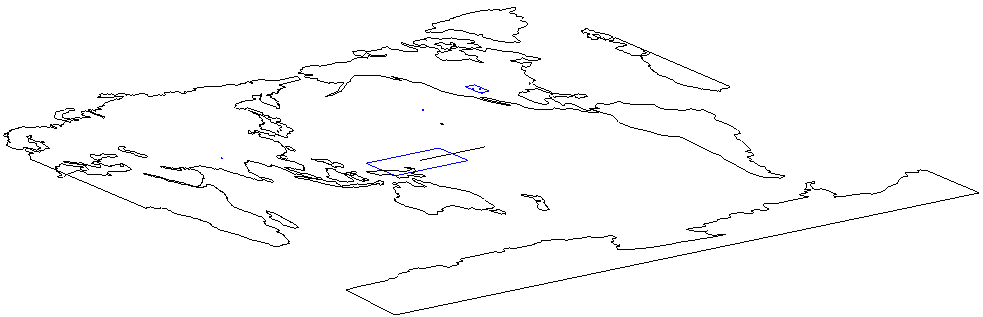
surface map orientation
Quasigeostrophic (QG) driven atmospheric circulation in conjunction with Solar forcing alone, appears capable of explaining the mechanisms of many, if not most of the important aspects of climate and longer term ocean states. The QG inspired mapping of the entire atmosphere as a single layer can be utilized in both forecasting as well as ad hoc analyses of virtually any past major weather event or moisture/drought pattern. Many posts within this site demonstrate exactly that, ranging from hurricane energy (ACE) to jet streams to polar vortices.
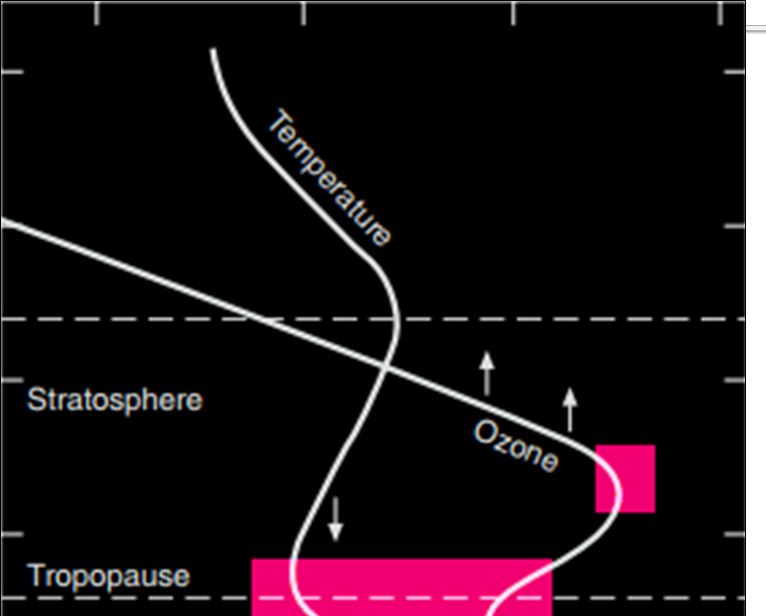
As the geopotential height of the full atmosphere Z rises and falls, it is generally understood, so goes the tropopause. Accordingly conventional representations of the top of atmosphere (TOA) and of the tropopause can be compared roughly against this Z examination. Most conventional representations of the tropopoause are limited to meridional cross sections through the atmosphere. Many diagrams are available to show the general pattern of lowest elevations at either pole and highest around the equator. They also show that the very highest zones are just to the north and to the south of the equator. They typically always average such data for the entire planet.
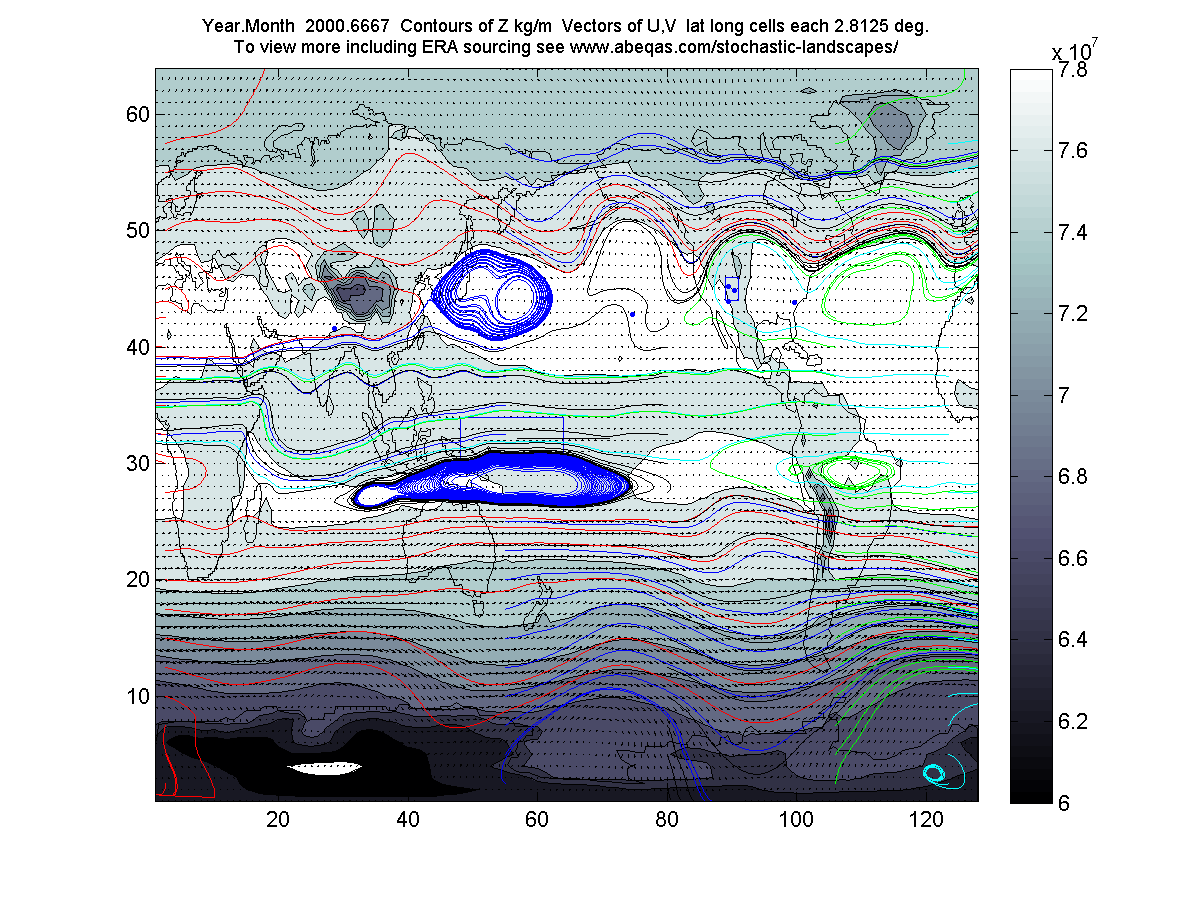
QG coverages here are geared to provide more comprehensive and practical information. A single cross section does not meet that goal. In this post I rely on some quasi 3D animations and the 2D contour below. The coordinates and the Z data of the featured animation are the same as for this image of one month (August) from that same data series. Accordingly, the same features can be observed from a different and useful perspective. In that respect for example, the relatively sharp indentations in the Z height surface in the animation identify major continental mountain ranges, just as the Z contours below indicate. Also the extreme lows of Z in the Southern Polar region are obvious in comparison to the relative lows of the Northern Polar region for both graphics. The generally high ITCZ covering the Tropic of Capricorn to the Tropic of Cancer has the distinct mounds and ridges of high Z which also identify the major gyres. The Z valley along the equator is clearly seen as well.
mw 2017
One reason for this exercise was to more fully examine the white areas of the 2D contour plot that wrap around the equator to the north and south. I knew the gyres filled those spaces but the upper surface elevations of those could not be seen under this contour setting. I produced more refined contour plots and saw/confirmed that each gyre is a broad mound and that the valley between has some topography of its own. I continue to examine with a focus on the undulations of these topographies, and that has led to these recent surface animations.
Of possible interest, actual hydrologic stationarity of some features can be identified as the moving average of animations is adjusted. The featured animation, which covers a monthly resolution for one year, has a somewhat “bouncy” and undulating wave-like flavor to it*. These features are notably damped for longer term averages such as a 5 year trailing average. In those cases, as the animation below indicates, the ITCZ surface remains relatively stable.
A final animation focused on the ITCZ for two cases from the previous animation, namely the 5 year trailing average for 1985 and 2005. Note that in my annotations I define a year as a “year.month”. Accordingly the charts display 1986 and 2006 to indicate the very end of 1985 and 2005 respectively. I have featured roughtly these two time sets in several past posts because of their importance to streamflows of the Southern Rockies where I work. The entire surface shown is limited to the elevated Z region associated with the ITCZ including the northern and southern extents of the major gyres. Each gyre can be seen as a peak. For example the North Pacific Gyre is the high broad peak at the back of the surface and the North Atlantic Gyre is the somewhat lower peak to the right of the North Pacific Gyre, also at the back. The South Pacific-Indian Ocean and South Atlantic Gyres are also clearly defined by peaks at the front of the surface.
Most notably, the ITCZ appears to rise and fall as a somewhat rigid mass in this examination. Nothing is apparently undulating. Quasi stationarity of the Z surface shape across the tropics appears nominally confirmed for this climatological span. This is consistent with past exercises showing the gyre centers were relatively stationary at a five year climatological average.
ITCZ 1985 vs 2005
As a long time surface and groundwater hydrologist, I always must resist the impulse to view the Z value as if it were the surface of an incompressible single phase fluid. Of course that is not the case and many aspects such as rising and falling gyres can be cited as examples. I have focused here on the equatorial valley of the ITCZ. This is a manifestation for that band around the planet of a concentration of atmospheric moisture, which depresses the Z value in comparison to surrounding dry air of the gyres.
* Numerous waves are associated with atmospheric flows at different scales of time and space both barotropic and baroclinic, zonal and meridional and more. I plan subsequent posts to more explicitly address.
 3673total visits,4visits today