Condensation of Water Vapor at the Tropopause and Effects upon Temperature and Ozone.
The more I investigate the existing literature, the more the evidence builds that:
- Moisture in the atmosphere is highly (and typically anti-) correlated with the concentrations of ozone in the atmosphere, no matter how the two are profiled.
- The tropopause defines one of many locations for both moisture-related latent heat production and ozone destruction. The tropopause signature may diminish where air columns are dry.
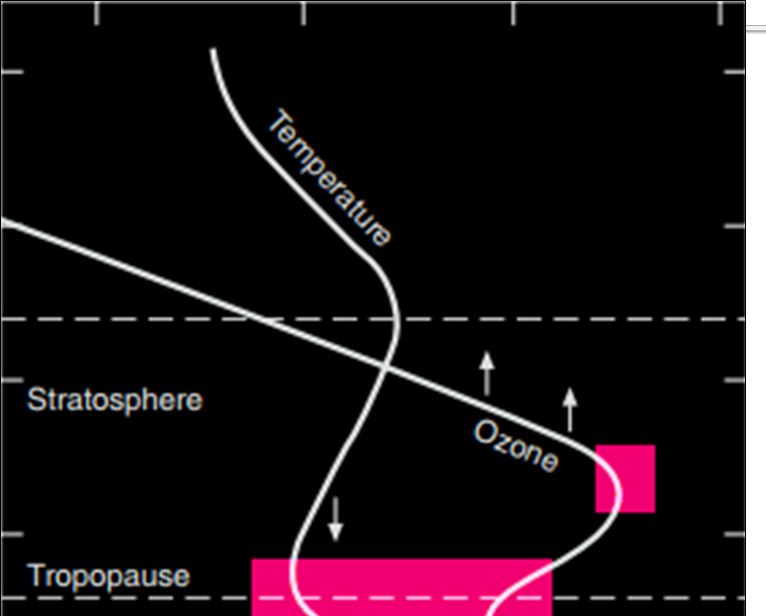
The featured image, derived from reference [1] is a good place to start. The image explores variations in temperature and ozone throughout an average height profile of our full atmosphere. The figure indicates that ozone concentrations reach their relative peak in the upper stratosphere and reach a relative minimum at the tropopause. Temperatures also reach a well known minimum at the tropopause.
I’ve become accustomed to reading references such as [2] and [3] which imply that the temperature minimum at the tropopause is directly and exclusively due to ozone. I think I understand how the dissociative reaction of ozone via UV-B absorption can produce a temperature spike that develops above the ozone concentration peaks in the middle stratosphere (see featured image). In actually dissociating into smaller, more energetic molecules, leading to more collisions with surrounding air, the thermal increase seems logical. That’s a different beast than non-dissociative IR absorption for example.
Likely some of this heat increase occurs at the tropopause as well. However, an additional and perhaps significant cause of the temperature change at the tropopause may be simply due to the release of latent heat from condensing water vapor. After all, this is the elevation where water vapor drastically drops in concentration (due likely to that condensation). It’s also accordingly the elevation where cirrus clouds prevail and “liquid droplet” cumulus clouds are no longer found (noting also that the anvil heads of cumulus clouds, when and where they occur, are effectively the icy cirrus part). In fact, there would be additional latent heat associated with the transition from liquid cloud droplet to ice cloud particle. Moreover, given the temperature lapse rate and the elevation of the tropopause, the freezing point is sufficient without the need to invoke additional requirements such as nucleation particles from aerosols or the like.
Also, if the release of latent heat just above the tropopause contributes to the subsequent reversal of the lapse rate, perhaps the underlying cirrus clouds somewhat amplify that impact, at least during daytime, when they reflect sunlight upward as well. In other words, the cirrus clouds would represent a type of reflector oven, enhancing temperature above its surface, just as the Earth’s surface does.
Finally, the divergence of latent heat is well known to exist somewhere along the moisture convective column, but it is typically not clearly defined in the literature. I did find a relatively recent reference which indicates some stunning correlations between the ozone inflection and the temperature inflection at the tropopause [4]. I’m reproducing one figure from that reference below:

Months are numbered sequentially, along with a shorthand for the calendar year, which both define the horizontal axis while the vertical axis represents height above the land surface in kilometers. The three time series profiled express three distinct parameters that help to define the average tropopause height over the Tropics, for a recent 11 year period. These parameters are:
CPT = Cold Point Tropopause, LRT = Lapse Rate Tropopause, and OT = Ozone Tropopause.
The CPT and the LRT are closely related by convention. The LRT represents the elevation where the nominal linear temperature lapse rate of approximately 6.5 degrees (C) per kilometer ends. That lapse rate trend ends at a minimum temperature, which is roughly the Cold Point. The ozone minimum concentrations were concurrently and independently estimated from measurements at the same elevations and found to closely parallel the CPT and LRT.
Notably this paper makes little or no mention of atmospheric moisture. I searched for related terms and only found one mention of “water vapor” and that was only found in a reference. Accordingly, this paper joins others in a disregard of the connections of water vapor to ozone. However, it seems to me that the connection to moisture is evident, if one assumes my simple notion. In other words, rising moisture that is convected upwards in the tropics reaches the Cold Point (the tropopause) and rapidly condenses to ice crystals. The convective moisture works also to deplete ozone until that moisture condenses*. Above the condensation level, there is little moisture vapor left to control ozone and so the ozone concentrations begin to again increase with elevation above the tropopause.
Eventually the ozone concentrations reach a peak approximately 20 kilometers further up in the stratosphere, and another temperature peak is noted 20 kilometers higher than that. There is much left to understand for me, but in any case my focus as a hydrologist is on the moisture components. Accordingly, I think that moisture based explorations of ozone are beginning to gel into something more coherent and which perhaps demonstrates that a tropopause elevation is most strongly expressed when there is moisture in the air column. Widespread depictions of the tropopause appear to confirm by only showing patches of the entire profile, and those appear to be limited to areas where atmospheric moisture is most prevalent.
The Sivakumar et al., 2001 paper [4] seems to implicitly recognize this limitation concept. The paper explores the tropopause at “the region of most active convective mixing over the western Pacific Ocean“. That region happens to coincide with the zones of greatest concentration of atmospheric moisture on the planet. It could be that other regions were of interest, but the tropopause signal was strongest for moist columns.
This points to an area of informal investigation that might address part of my concern. If a CPT or an LRT for example, is found at higher elevations (lower pressures) for dry conditions than for moist ones, then it would support the idea of the contribution of latent heat from atmospheric moisture.
I’ve taken a quick look at some Skew Temperature plots for an informal comparison[5]. The next three images summarize information of interest for the morning of 16 December, 2017, for three stations in the Western US; Salt Lake City (KSLC), Denver (KDEN), and Albuquerque (KABQ). I note that all three are at the same nominal surface elevations of approximately 1 mile above sea level (Salt Lake City is somewhat lower). However for this time and date, Denver and Albuquerque were sunny and cold, while a snowstorm was passing through Salt Lake City. Accordingly, if my notion is right, one would expect the LRT and CPT elevations to be lower for Salt Lake City than for Denver or Albuquerque. The temperature curve (right white curves) inflections above 250 mb for the figures confirm that this is the case. The SLC inflection occurs roughly at 250 mb, while the other two stations show the inflection occurs at approximately 200 mb.
Source of each of above three images is reference [5].
This was informal and doesn’t begin to constitute proof, but it’s interesting to me. I’m certain that these patterns are more commonly understood than I have found so far and I thank any readers for participating in my learning curve. Any are welcome to email me of course. I typically focus on the full atmosphere because of useful applications to streamflow forecasting. Were it not for the apparently largely disregarded relations between atmospheric moisture and ozone, and their associated residence times, I might not have attempted to go into quite so much detail regarding layers such as the tropopause surface within the atmosphere. I’ll continue to explore this to the extent it aids in forecasting, and will likely update this post as I can to correct and/or augment.
[1] image adapted from Figure 1 of https://www.ucar.edu/communications/gcip/m1sod/m1pdfc1.pdf
[2] https://eo.ucar.edu/basics/wx_1_b.html
[3] http://elte.prompt.hu/sites/default/files/tananyagok/AtmosphericChemistry/ch01s04.html
[4] Sivakumar, V., Bencherif, H., Begue, N., and Thompson, A.M., 2011, “Tropopause Characteristics and Variability from 11 yr of SHADOZ Observations in the Southern Tropics and Subtropics” Journal of Applied Meteorology and Climatology 50, pp. 1403-1416
[5] Unisys Weather, http://weather.unisys.com/upper_air/skew/
This is a work in progress and contains opinions. Thanks as usual go to the Las Cruces Atmospheric Forum for informal feedback even when we disagree.
*How moisture can destroy ozone is a well known feature of chemistry and a topic I plan to address in yet another post.
 6035total visits,1visits today
You May Also Like