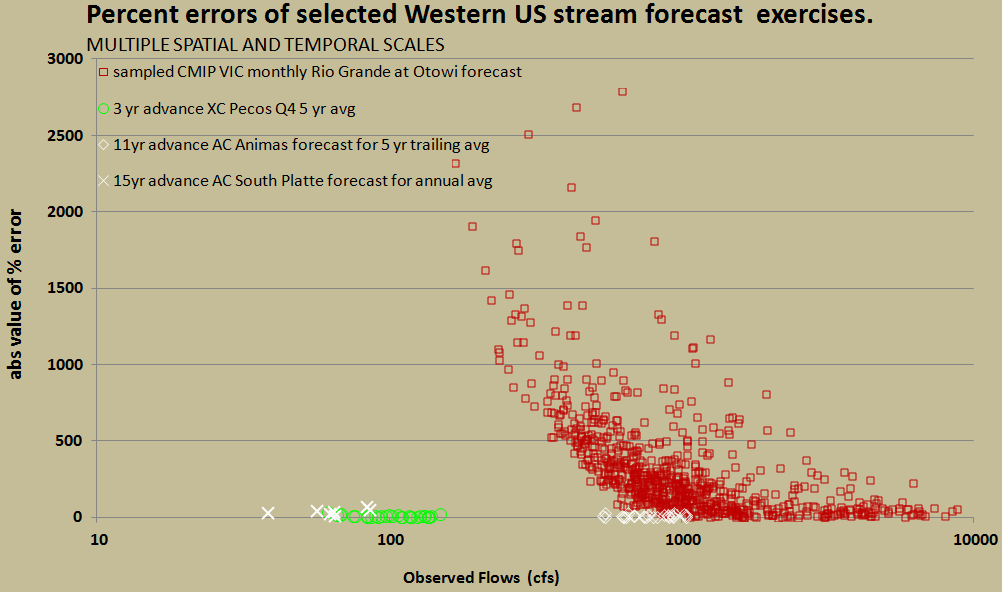
High accuracy and transparency for value-added solar based hydrological forecasts are the primary objectives of my research efforts to date. The featured image above displays three of my forecast exercise products, one in green and two in white symbols. The large mass of sampled red CMIP-VIC [1] simulation outcomes are from an outside federal forecasting resource for comparison.
For my work, I continue to document the performance of and to extend multi-year forecasts for rivers and streams including the Pecos River near Pecos, New Mexico. I originally set out to transparently forecast flows in the Pecos in late 2015. The latest performance shows a similar degree of relatively high accuracy that I premiered in previous posts. I have also submitted the original development as part of a paper in peer review.
My first forecast for the Pecos is captured in part in this image below. Additional information is found in the original post published early in 2016.
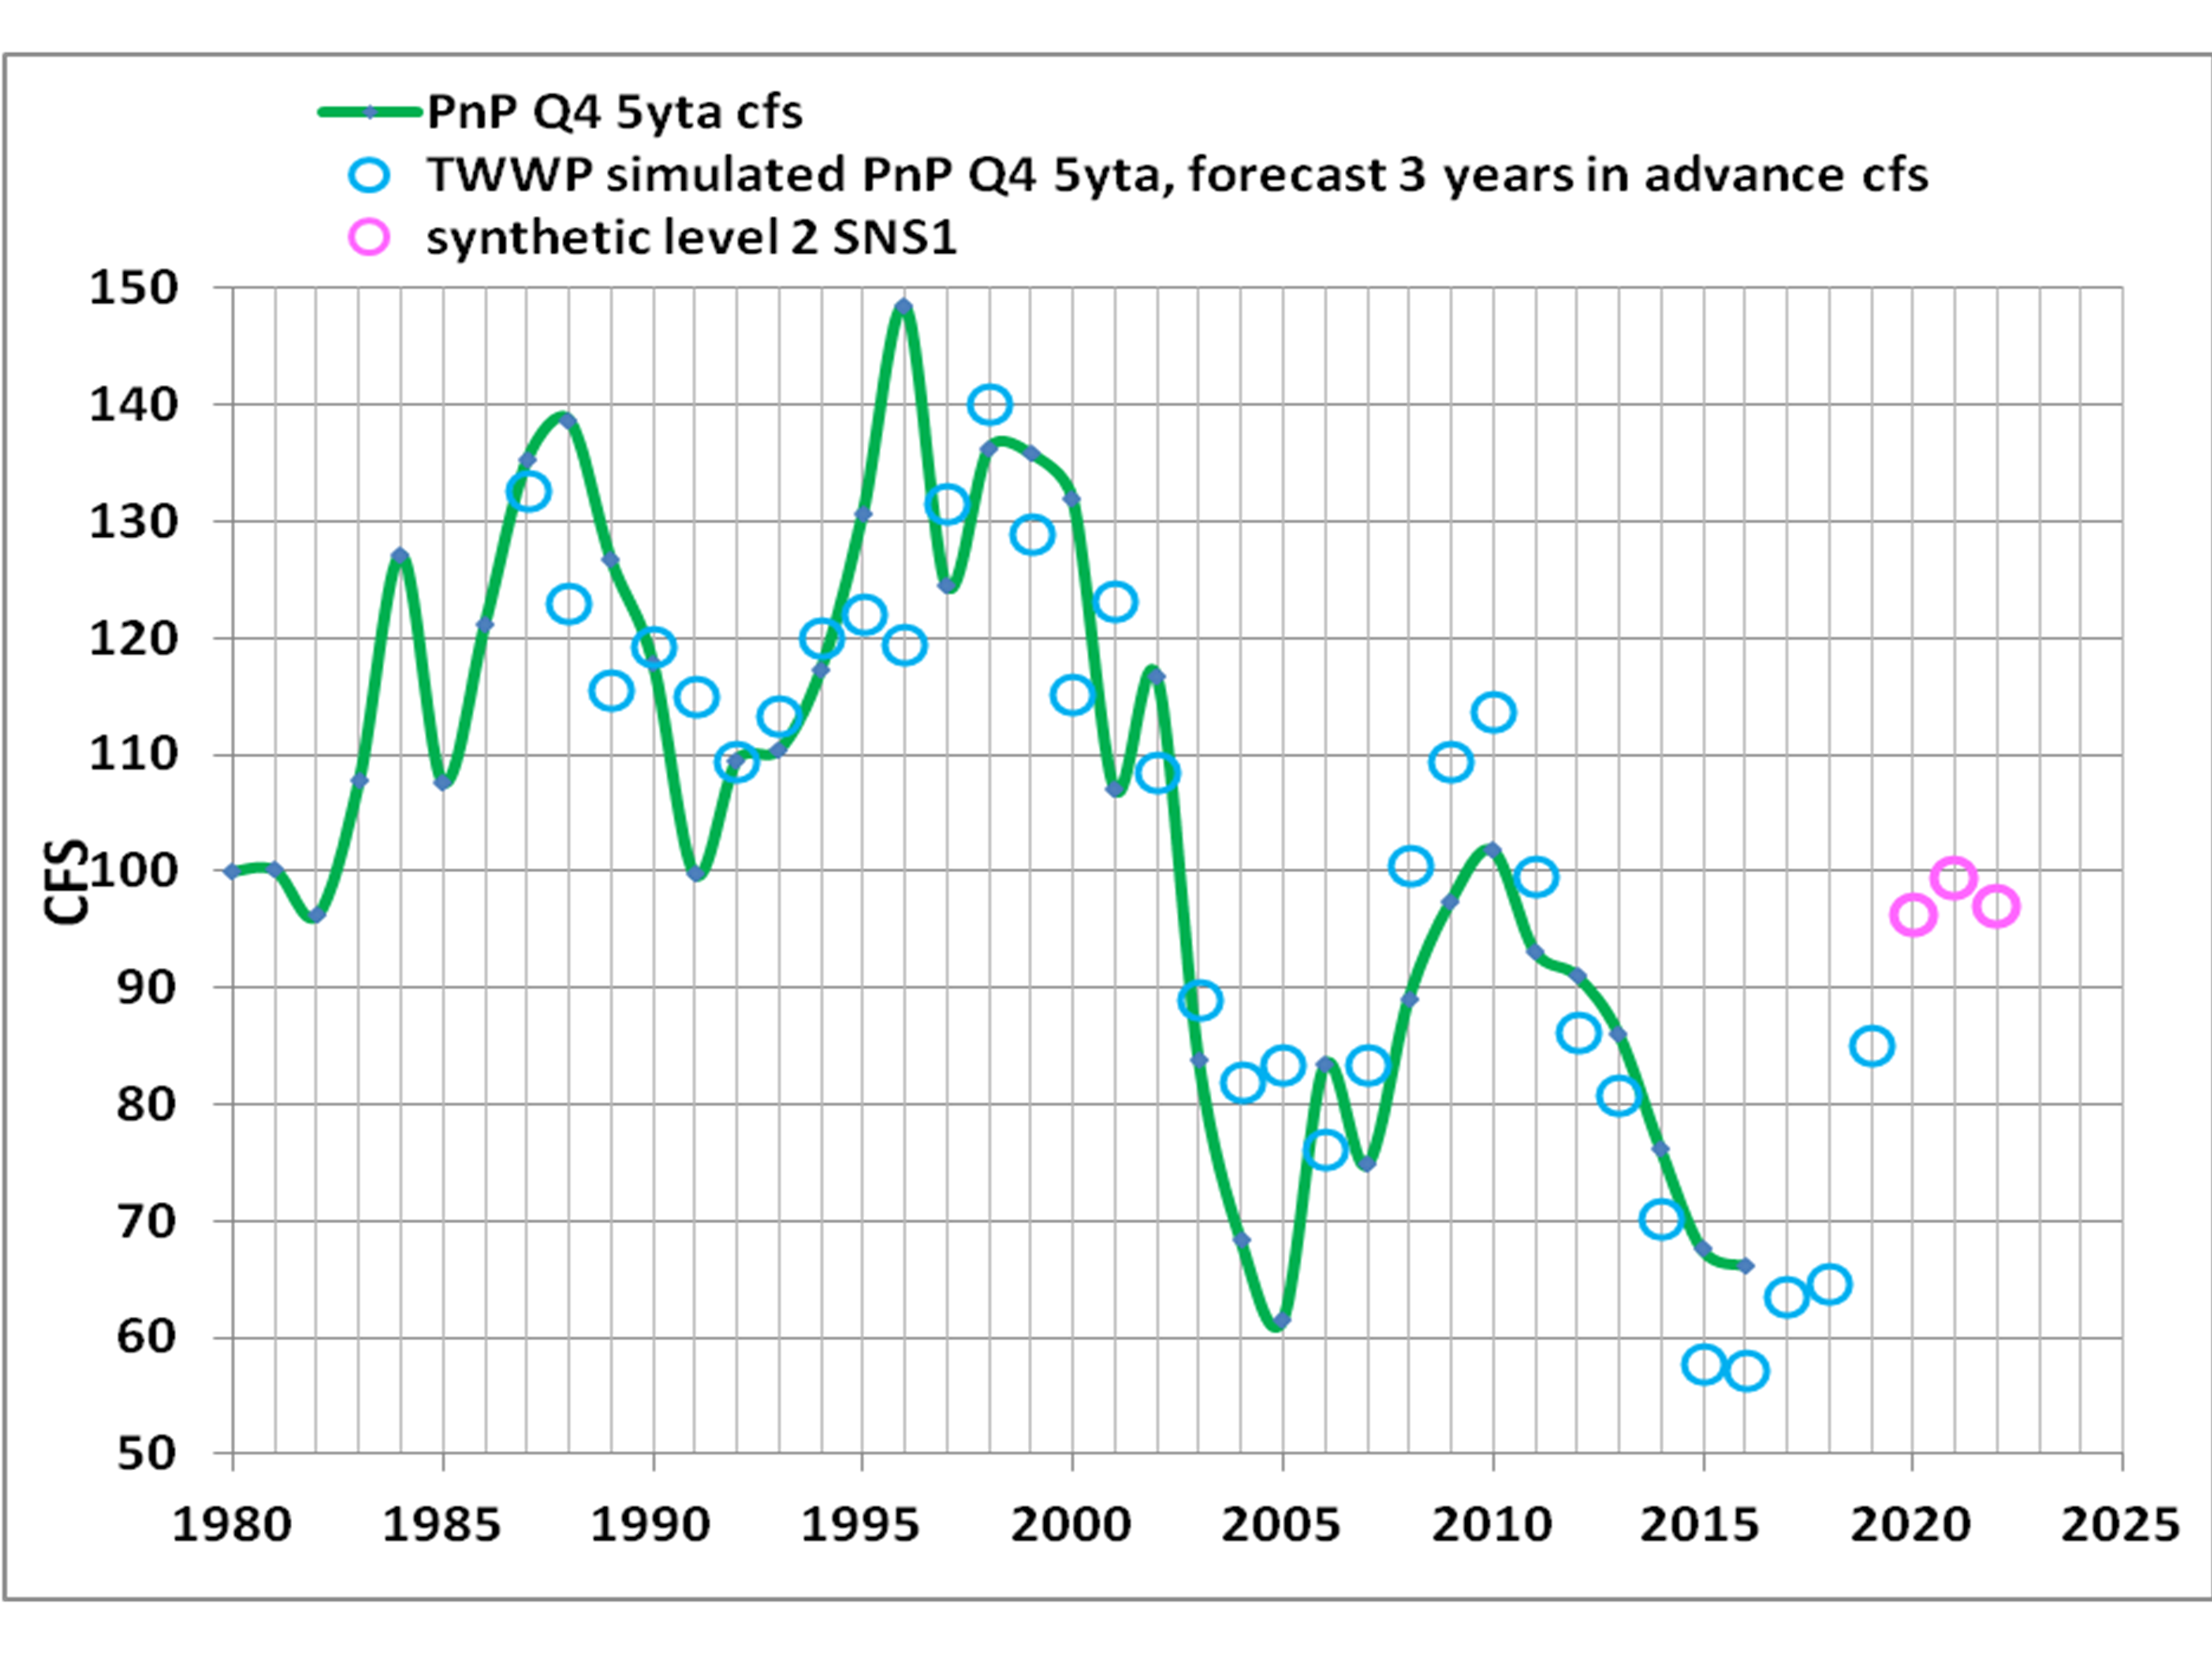
As documented, the 3 year advance forecast exercised in open cyan (blue) circles had already shown a significant similarity to the observations in the solid green line. I now have revisited the forecast to evaluate its accuracy since that time as shown in part by the next image.

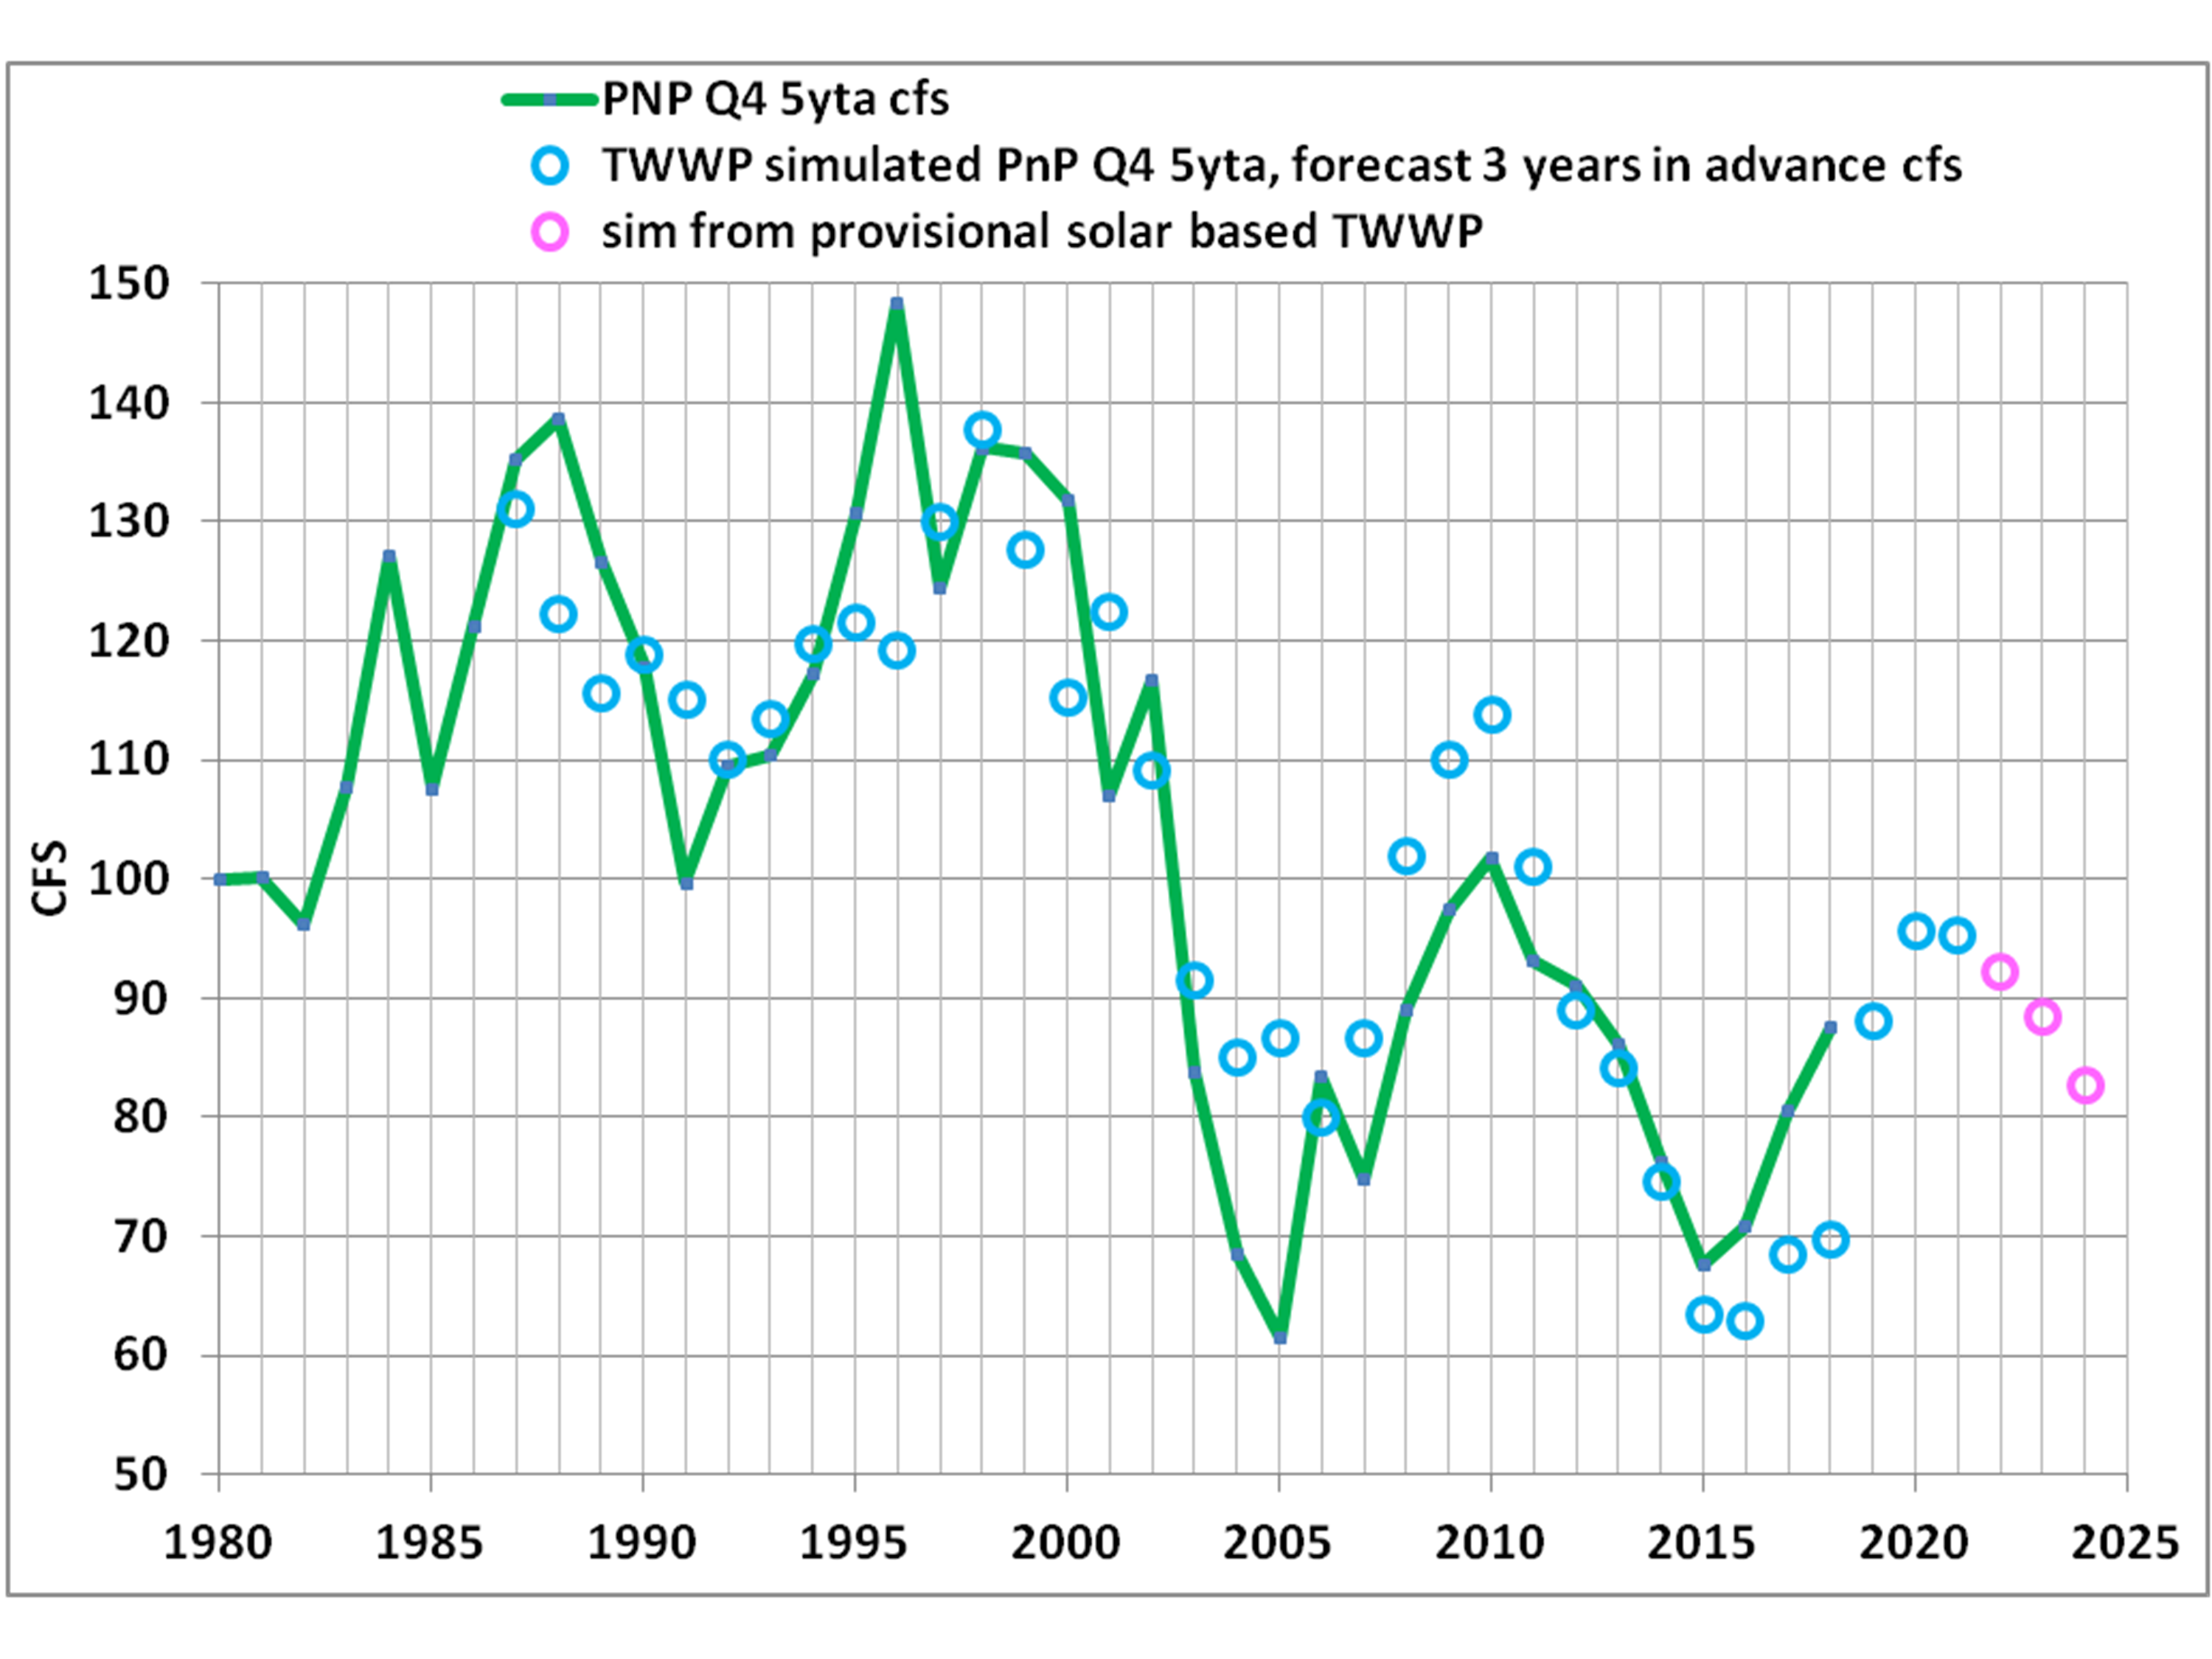
The relatively high fidelity to the observations has continued over the past two years although a lag adjustment may be merited in future forecasts for this moving average case. The minor differences in the green line for the common span of history to the previous plot are primarily an artifact of the USGS re-adjustments applied to the record for this stream since 2016.
I have also updated the forecast using the same methods to extend to the year 2024 in the next image below. As noted in the original post, the magenta open circles are a function of the use of a solar driver as a component of this forecast. This adaptive method, favoring a conceptual model of a global axle of total solar irradiance (TSI) and the resulting long term circulation changes in the hydrosphere, is geared towards the highest fidelity for the longest spans and shortest scales. The cross correlation (XC) process remains for now as a 3 year span forecast via the blue circles and a terminating 3 years via the magenta circles. The new forecast includes an updated regression fit to include the entire time series used for this stream. A new regression for the full time set is utilized for each new forecasting update, in line with routine regression forecasting practices. Accordingly the blue circles now show a somewhat different fit through the entire series.
A BIGGER PICTURE
On a broader note, the featured image at the top of this post and its log scaled representation below explore the accuracy of several forecasts and hindcasts I’ve developed for streams of the Western US. The white symbols designate autocorrelation (AC) approaches. The green circles represent the Pecos forecast featured above which draws from a research exploration of a TSI axle based XC to other precursors. For comparison and context, a CMIP-VIC based predictive product is included for the Rio Grande from the West-Wide Climate Assessment (WWCA) [1] identified by the cloud of red symbols.
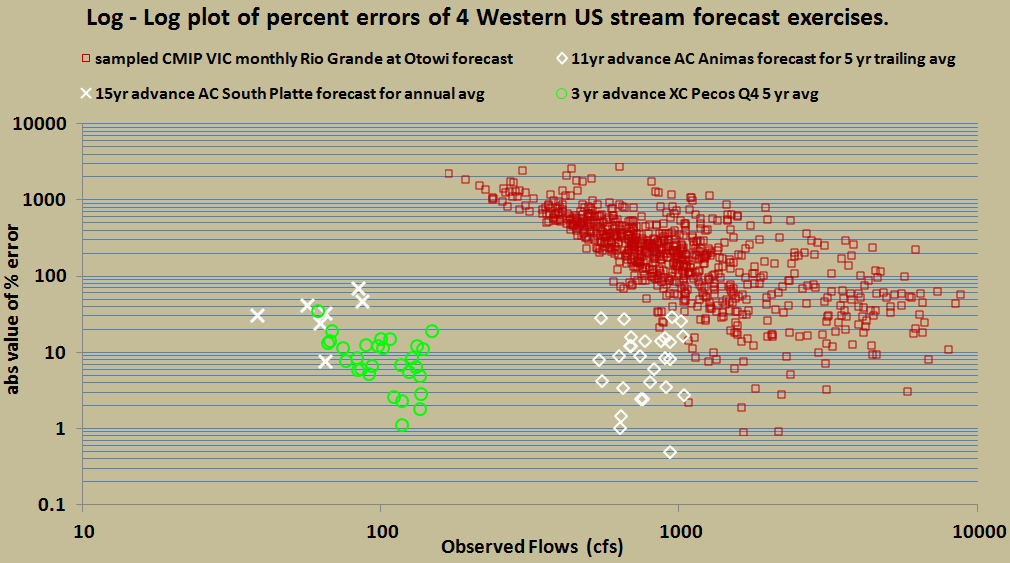
The green and white low cost approaches appear in context to demonstrate significantly higher accuracy at any scale to the sampled CMIP-VIC simulation product.
I recently moderated a climate session at the Arizona Hydrological Society [2] conference and I was pleased to learn that some WWCA customers within the agencies which manage water in the west are beginning to explore how to work around the shortcomings of the CMIP-VIC simulation products. As part of that exploration, and supported by the capacity of a new team of approximately 50 highly skilled professional hydrologists and water rights engineers, I invite any water manager to learn more about the lower cost higher accuracy approaches that are premiered here.
*Those are based on the onset of full satellite coverage of the planet beginning around 1979.
[1] West-Wide Climate Assessment run number streamflow_riog_usbr_mon_00030. This run is associated with the US Bureau of Reclamation report “West-Wide Climate Risk Assessments: Bias-Corrected and Spatially Downscaled Surface Water Projections Technical Memorandum No. 86-68210-2011-01
[2] Wallace, M.G., 2017, Session Moderator and Presenter “New Solar Based Moisture and Temperature Forecasts in the Western US”, Annual Symposium of the Arizona Hydrological Society, Flagstaff Arizona (September 8)
all a work in progress and frequently updated as of summer 2018