One of the values of the scientific method is that notions can be routinely challenged. One would think this is more than just “nice to have”, because through that method, the irreproducible and nonsensical items are filtered out of our mainstream. For a notion to emerge into our scientific mainstream, it should pass through some serious (and fair) gauntlets.
The gauntlets are not trifles. They first require that the scientific notion be framed as a hypothesis or theory. That leads directly to predictions which can be tested (more gauntlets). But no scientific-sounding notion can be tested or challenged or verified or even debunked by any model and/or simulation. Models and simulations are only elaborately tuned notions themselves. Models must accordingly be tested against observations just like any other notion.
Sometimes any testing of a notion or model is simply not permitted. That’s right. Karl Popper defined those notions as non-falsifiable. Popper argued that the only way an irreproducible claim can flourish is if it cannot or will not be challenged. It then is “elevated” to an Unfalsifiable condition.
Few notions to me appear to be as irreproducible as The Madden Julian Oscillation (MJO). I think it may be a fully imaginary construct. It may only persist because none have decided to challenge it. In fact, abeqas.com may be the only site where the MJO receives any challenge at all. The MJO is also a close cousin to another notion which seems to beg for additional quantitative testing, namely the El Nińo Southern Oscillation (ENSO). There is quite a dance between these two popular acronyms. The ENSO has about 15 different sub-indexes. The MJO has 8 different “phases”. Both are claimed to be inter-related. Both are argued to profoundly influence our weather and climate.
The difference appears to be that ENSO measurements are at least reproducible, even when ENSO based predictions fall short. In contrast, MJO measurements do not appear to be reproducible. I know because I asked. I’ve looked into this for a number of reasons, but the abundance of contradictory definitions was all the invitation I needed. According to a variety of descriptions, the Madden Julian Oscillation (MJO) is a monthly, or bimonthly, or trimonthly, or weekly, or some variation between all of those, migration from west to east of precipitation patterns along the equator, or along the tropics, or from pole to pole. It migrates between the Northern Indian Ocean and the Eastern Equatorial Pacific, or it migrates around the world, or it migrates from the western Pacific to the central Pacific. It is influenced by temperature patterns including ENSO, and it influences temperature patterns, including ENSO. It influences monsoons and it is influenced by monsoons. It is a wind parameter, it is a temperature parameter, it is a moisture parameter, it is an outgoing longwave radiation parameter. It is best observed from late March through early June, or from late November through March, or from January through April. It is strongly associated with 8 “phases” which are “times”, or which are “regions” or which are some other thing.
Is any reader satisfied with this description? I’ve been asked by others to examine it because they were not satisfied. After a few cursory exercises and outreaches to subject matter experts, I’m not satisfied either. And as always I have much to learn. But this initial post is simply intended to introduce the MJO jungle and not dive into its trees yet.
If the MJO cannot be consistently defined, then it cannot be falsified for that reason alone. The lack of definition of a notion is often its armor so this is not unusual for unfalsifiable notions. Much of my concern stems from the following MJO description
https://www.climate.gov/news-features/blogs/enso/what-mjo-and-why-do-we-care#comment-3275
The first graphic at the page appears to identify a progression from west to east of heavy rainfall (in green) over 8 distinct Phases.
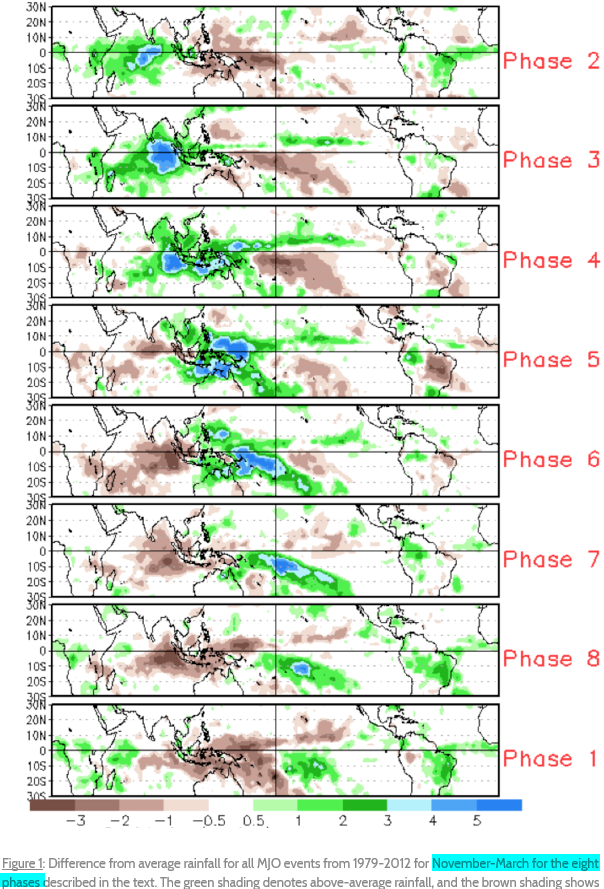
Whatever else the MJO authors assert, this progression is a hallmark. It also cuts against the grain of what is well known regarding equatorial atmospheric circulation. This may have crossed the minds of many, simply because the primary direction of atmospheric flow within the equatorial latitudes is from east to west. Not from west to east.
There must be a reason for these frames to appear the way they do. I’ve reached out to NOAA to inquire. I asked for the source and date(s) of each of the 8 frames. I received an answer. I’ll follow up with Part II of III soon to share that news. For now I can say that the response appears to confirm that the MJO is irreproducible.
To close for now, I’d like to first boil the MJO down to a simple definition: The MJO is a presumed retrograde motion of moist equatorial air from the northern Indian ocean to the Eastern Pacific every year from November through March.
If I missed something above, any can correct. Perhaps there is a subtle signature. On the other hand, if it is so subtle, and if no effective forecast techniques are inspired by it, then why is so much attention devoted to it? In other words, if any modeler plans to better simulate our hydroclimate, then I recommend they try to capture this seasonal pattern below.
click to animate. Derived from ERAI by abeqas
Each frame comes from maps from the well-known euro satellite re-analyses (ERAI) resource for the full atmospheric thickness, over a 36 year time span. The blue shades cover areas where precipitation strongly exceeds evaporation. The green shades cover the reverse.
I’ve included streamlines. The yellow lines all originate from 10 deg latitude. The white lines all originate from the equator. The magenta lines all originate from -10 deg latitude. In this animation I’ve added some streamline origins in blue for both polar regions.
In July and for several months before and after, the tropical flows are “well behaved”. They flow from east to west. In January and for several months before and after, the tropical flows are disrupted across the eastern Pacific. They diverge from the equator. That divergence is associated with the western hemisphere warm pool, a referenced term in some papers. This is only a blog, but I’m happy to cite my own peer reviewed paper for added context [1]. At least that resource happens to also describe the northern and southern oscillations of the deep blue Equatorial Trough. Most MJO literature that I’m familiar with makes little or no reference to this orbitally – forced pattern.
In any case, as every January is approached, the normal easterlies along the equatorial trough begin to diverge. This divergence, which happens every year in that warm pool, may be what the MJO enthusiasts have mistaken for their notion. But they have only explored a narrow sliver of that mega phenomenon. In any case, I’m simply noting the bigger atmospheric picture. In the next two posts of this series, I’ll continue to compare this big picture to their little one. For now this introductory post has only noted that their little picture includes some irreproducible maps and possibly additional contradictions.
References
[1] Wallace, M.G., 2019, Application of lagged correlations between solar cycles and hydrosphere components towards sub-decadal forecasts of streamflows in the Western US. Hydrological Sciences Journal, Oxford UK Volume 64 Issue 2. doi: 10.1080/02626667.2019.