Glaciers would grow from a warming Sun
With some caveats, it is not even controversial that glaciers would grow in a warming world. I think the notion is plausible if loosely interpreted. But don’t only take my word for it, consider the words of NASA glaciologist Jay Swally: “At the end of the last Ice Age, the air became warmer and carried more moisture across (Antarctica) doubling the amount of snow dropped on the ice sheet.” The 2015-2016 research also concluded that the ice over at least half of Antarctica has been growing. [1]
Most of the ice across Antarctica has been growing.
The article also drew attention to the fact that this challenged the UN IPCC glacier claims of the time, along with a disclaimer: “.. it might take only a few decades for Antarctica’s growth to reverse…I don’t think there will be enough snowfall increase to offset these losses”. Many have discussed this 2015 study, but the topics they favored are not aligned well with the solar and hydroclimatology focus of this site. In my perspective, Dr. Zwally appears to have argued that a naturally warming world caused more frozen water to bury Antarctica, but that the current anthropogenic-only warming, will have the reverse affect.
For my notion that Solar warming equates to glacier growth, it would be helpful to have the kind of understanding of glacier ebbs and flows that we largely have for streamflow records going back about a century. So before I explain this notion, I must come to a better understanding myself of land ice accounting. For example, the featured image may be compared to this more official glacier tally from the Randolph Glacier Index (RGI) and featured from my last post.
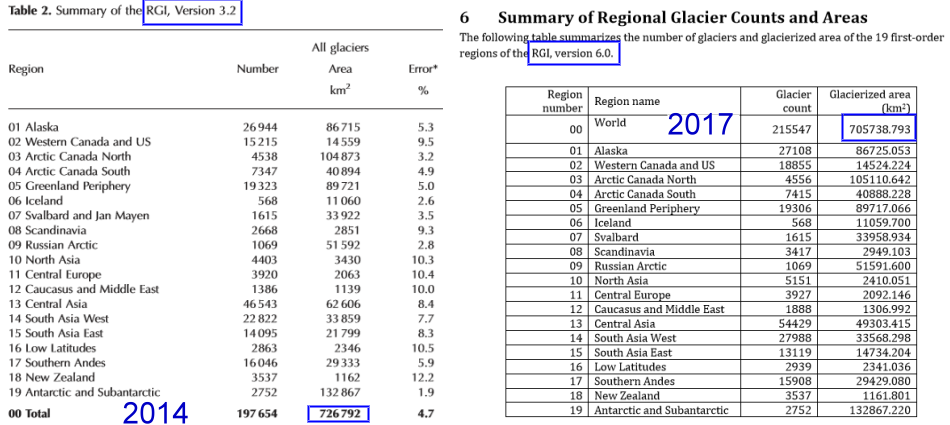
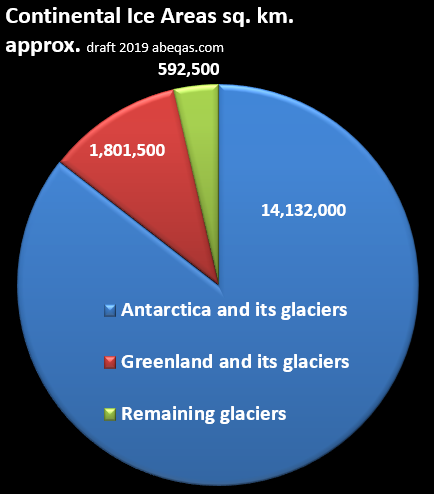
According to the RGI, the total area covered by glaciers, including Greenland and Antarctica is only about 730,000 square km. This is 22 times smaller than the 16.5 million square km of ice tallied in my featured image above. Ice covers almost the entirety of Greenland and Antarctica. Most of it is moving slowly, just like any other glacier. If all of this ice melted, then the sea level would rise significantly. Accordingly it should also be tallied in RGI and other resources, because sea level rise is what they seem to be most interested to project. Also, I can point to a Glacier update post or two, which identify places where ice has been growing in parts of both Greenland and Antarctica.
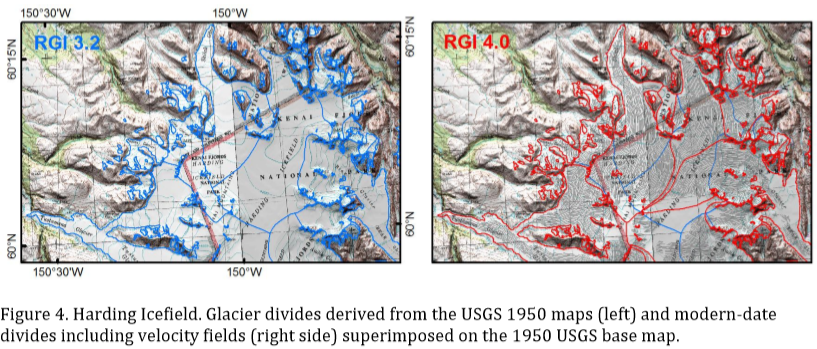
A critical question accordingly and yet again concerns whether certain glaciers are stable, or shrinking or growing, especially given the inconsistent reporting from both media and scientists. For example, I came across this interesting before and after map of Alaska’s Harding Icefield Glacier from [2]. The left image covers the 1950 map and the right image is a “modern day” map. I can’t see any difference myself, other than the color used to delineate the glaciers. I would like to conclude that these ice fields haven’t declined since 1950.
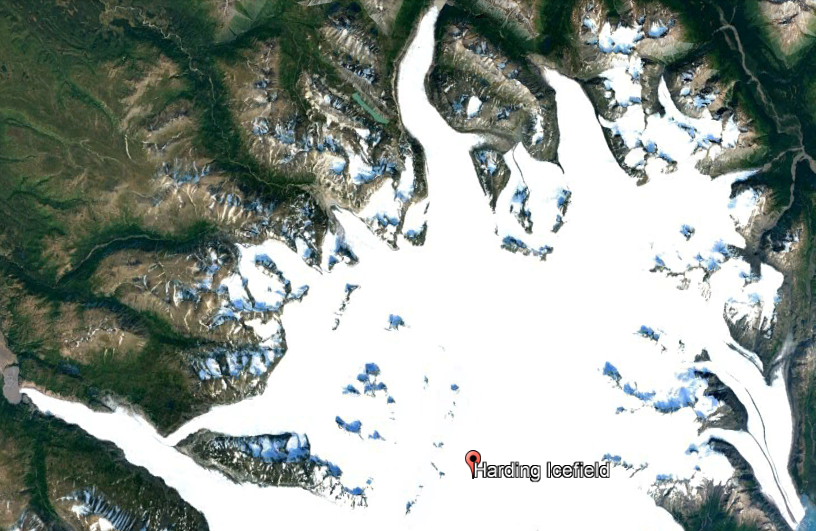
It looks as if that was a safe conclusion, based on this November 2018 Google Earth clip of the same area:
I am finding it hard to easily identify cases where glaciers are currently shrinking. I’ll keep looking or perhaps an engaged reader who knows of such a glacier could reach out to this site. The public was fooled by the long-reported shrinking Glacier National Park case. Natural resource managers and others appear to have incorrectly broadcast a declining glacier pattern there for many years.
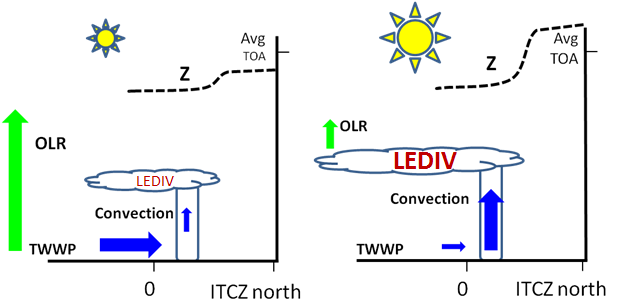
To sum up some preliminary notions here, there are many inconsistencies in messaging about glaciers, especially, why giant masses of moving land ice are excluded, and also with respect to alleged declines. In fact there are many areas of concern, but as a hydroclimatologist I’m interested to know if more atmospheric moisture leads to more glaciation at least in some areas. Perhaps this is likely for decadal and finer time-scaled climate, but as the NASA glaciologist speculated, the same pattern might hold for millennia. Many scientists including most global climate modelers also believe, and I am among them, that a warming planet leads to greater atmospheric moisture. We don’t agree on much else though and my link proves that. I hope readers will review it because it is critical to this post. Among other informal findings are that the temperature of the planet has been relatively constant over decadal spans. In the solar-climate-forcing model I explore, higher incident radiation to the planet’s surface, resulting from higher sunspot counts (when they occur across a typical 11 year solar cycle) lead directly and immediately to higher evaporation (via the the well known Clausius Clapeyron relationship). This literally removes heat from the atmosphere and that is what my previous post points as the reason why our full atmospheric temperature remains so constant. That heat “storage” is somewhat like the alleged greenhouse gas effect, except that it is real.
Most if not all clouds ultimately derive from that evaporated moisture, and most clouds form above the 3 km high planetary boundary layer (PBL). This indicates that the heat returned to the atmosphere by the condensation of each cloud is logically returned to that upper atmosphere. The upper atmosphere is a stone’s throw from absolute zero temperatures of outer space. Accordingly only a small fraction of the heat that is removed by evaporation at our oceans is returned to our planet. So under a higher total solar irradiance Earth doesn’t actually get warmer, but it does get somewhat wetter.
For my past work I had focused only on the time scale associated with a few solar cycles; basically a few decades to a few centuries. I know that these processes occur all of the time and at any scale. They appear to have the potential to explain longer term major glaciations. In other words, increased total solar irradiance (TSI) might have caused the ice ages. If this is easily dismissed I’m happy to admit I was off on a limb. It is the purpose of science to explore potential epistemic limbs, and most fail in any case. On the other hand if this limb doesn’t break, then any prior art which can be found will be sought and cited. And if this post ends up bringing novel elements to the concept, then citations by later more peer reviewed products, including by myself, are expected.
For now I can start with this nice comparison image set. The right image features our average March geostrophic circulation (streamlines) and contours of Evaporation minus Precipitation (EP). The jet stream is visible across eastern North America by the convergence of streamlines. The left image by Dr. Dennis Hartman (U. of Washington) features a representation of the most recent great Ice Age the Wisconsin glacial period which ended about 11,000 years ago. It is certainly interesting if only for the “land bridge” and its implications for human migrations. But it’s also interesting because of the three major glacial lobes shown. The western one is clearly in the line of water circulation often featured here. The northeastern ice sheet is Greenland and that ice cap is not much different than today (at least from the perspective of this earth scientist). The Laurentide ice sheet in the middle of that map is of interest because it appears at its southern boundary to roughly parallel the Jet Stream. In my informal view, a nominally flowing mass of ice will be “liquidated” by its encounter with any decent Jet Stream. The truncation would be somewhat like a glacier calving into any ocean.
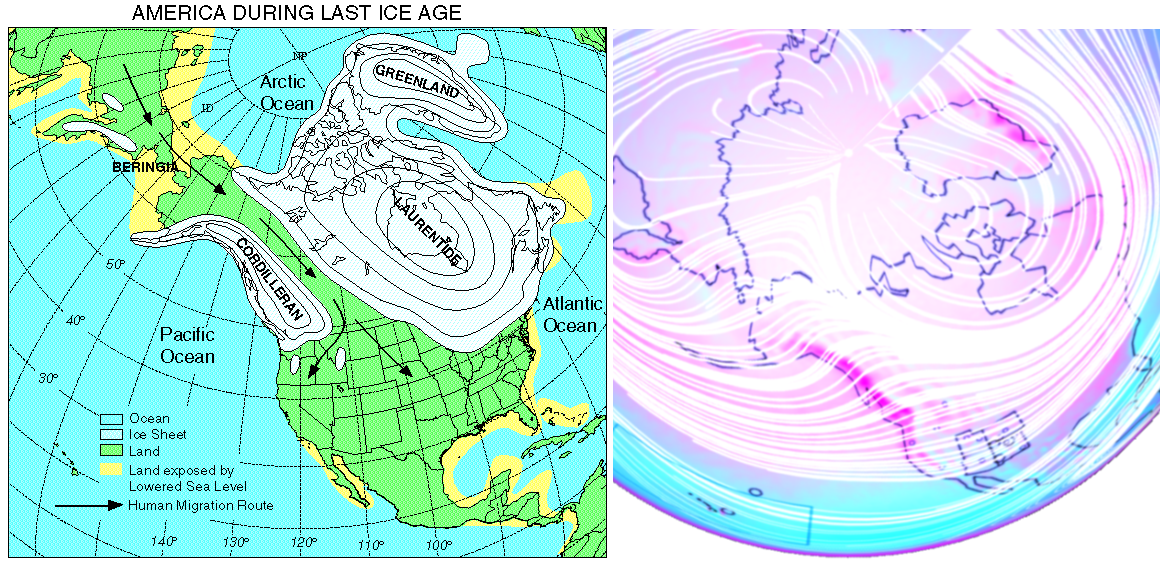
https://atmos.washington.edu/~dennis/OCC_Final_961216.html left. right from abeqas.com
I think the logical consequence would be that if not for the Jet Stream, the past ice age masses might have flowed all of the way to the Gulf of Mexico. It is understood in any case that climates could be warm to the south of the ice, and not too far south at that. Also it is well accepted that all of the water which fed the giant glacier masses came from the oceans and accordingly the sea level was much lower. This can be conveniently seen by the yellow zone in the above figure. I can venture that increased solar radiation perhaps from heightened sunspot activity led to increased evaporation and accordingly more moisture transport through Hadley circulation principals towards each pole.
While the Sun was heating up, more water evaporated from our oceans than the norm, and much of that water condensed above the PBL. This always happens. Perhaps over the Ice Ages, as we also see today, Hadley moisture transported across favorably-positioned mountains and regional centers of precipitation. So much moisture may have precipitated as snow in those specific “seeding” locales, that the higher TSI reaching those locations couldn’t otherwise keep up. Many recognize that if snow is continually added at a high rate over a region, the resulting glacier masses will flow into areas where snow is not continually added. This is not normally controversial, but the application in this context of a hotter sun and continental scaled glacier growth may end up so.
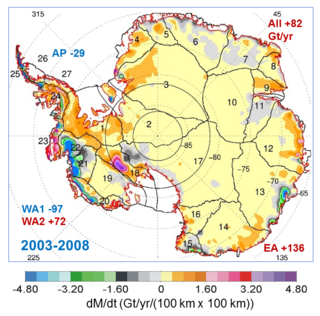
Given the currently consensus – accepted RGI ice tally, I may be one of the only hydrologists who think that the ice sheets of Greenland and Antarctica were formed in great part through this mechanism. Consider for example how dry most of Antarctica is. Most of the precipitation is limited today to a few sub regions and those happen to fit the profile I offered. I’ll return to that but for now within this post one can also simply refer to the Antarctica map near the beginning. The dark lines emanating from a high ridge demonstrate that high altitude and high latitude receptacles of atmospheric moisture are the conduits for ice to flow from those locales, to the sea, crossing continental spans where little snow falls. Also I have a very relevant paper to work from [3]. To try to close on this notion for now:
The Sun may have heated up over glacial eras, not cooled down. In this conceptualization, the hotter the Sun became, the more the oceans evaporated. Much of that moisture over time would naturally be sequestered (condensed and snowed out) through geostrophic circulation across high altitude mountain catchments and through circulatory moisture sinks tied to surface regions at upper latitudes. The accumulation over time and the subsequent gravity flows, could then have led to the continental scaled glacial masses over those Ice Ages.
This would be ironic if true. Yet it seems plausible when one simply follows the water. I think this is a type of conceptual model that can be falsified and so I’ll try to do so if others don’t. I’m sure this means I will be wrestling with the ice core isotopic ratio data and interpretations.
Most current isotopic ratio interpretations favor a colder planet. On the other hand, reports that tropical regions remained warm and lush throughout each Ice Age are hardly rare. If the entire planet was cold over every Ice Age, surely there would be evidence everywhere, including tropical and sub-tropical domains. But apparently that is not the case. I would say that this is very supportive of my notion but it could challenge the isotopic ratio data. So far I can infer that isotopic data in ice cores have been correlated to stream flows [4]. And ultimately moisture and temperature are related. Accordingly the temperature component is perhaps more subject to interpretation than the moisture part. I see, if only from figure 8 of [4] that more moisture in a river of northern Canada is correlated to more enriched 18O. I also see from Figures 2 and 3 of [5] that greater snow accumulation along the Antarctic Penninsula is strongly related to, again, more enriched 18O. This is apparent, regardless of what any might interpret regarding Temperature. So I will keep these items in mind as I continue to revisit deeper cores spanning glacial epochs.
Even without the benefit of those techniques, one might also ask why the entire Northern Hemisphere continents were not buried in ice. Why for example are there only a few giant lobes of glaciation? To me, again, that suggests the localization of moisture sources from atmospheric circulation. If I had to visualize, I might imagine a spinning Earth from which Hadley jets and/or fountains of water stream from the equator (roughly) towards somewhat stationary targets reaching (roughly) to each Pole. There would be differences between the two hemispheres but mostly this broad pattern is then incised by the jet streams. Again in this conception, the flow rates increase when the oceans are heated further by higher TSI. In the high altitude and/or high latitude catchments, the fountains result in snow much of the time. The greater the flux of moisture to those catchments, the more that snow will build up. The rest, including the lateral extents of the growing ice masses, are dependent more on topography than upon climate of the areas the glaciers invade. With enough time and moisture, a glacier can grow to Ice Age scaled masses.
No doubt these topical items both cover old ground but also perhaps they invite more questions and debate. Debates would play out even within the solar hydroclimatology niche of academia and research. I’m happy to initially point to an article about a paper by Dr. Helen Popova. Her work and related works by others have their own vision of solar – driven circulation through the Northern Hemisphere. I think the messaging of that resource is interesting, and I had explored some of that solar-cosmic ray terrain as a graduate researcher myself. But I also believe the paper and many others intrinsically adopt a universal assumption that a colder world equates with growing glaciations. Starting with Solar as the driver, I would certainly agree that a colder world indicates that less solar energy is reaching the planet. But to me, less solar energy means less driving of moisture out of the oceans and into the atmosphere. And that means LESS glaciation.
If I am on the right track, that would also mean that a colder Sun equates with a relatively drier full atmosphere for Earth. In a colder and “drier” Earth, rivers and the like such as the Thames which Dr. Popova’s article highlights, would still freeze more often and across greater spans of time. I guess that is an icy result, but it hardly measures up to the epic flows of mountain ranges of ice grinding across our continents. It may boil down to the use of the “ice” term to characterize both cases. Or it may not, as I keep in mind that this is only a blog. I recognize that glaciers in Europe expanded at times over the so-called Little Ice Age. On the other hand Europe is a peninsula of relatively narrow land surrounded by waters on three sides. Regional features like that ensure plenty of water whether the climate is relatively colder or warmer, and that is much different than continental Asia or North America.
For now I can only perhaps complement the North American glaciation notion with a new annotation of an older image of mine.
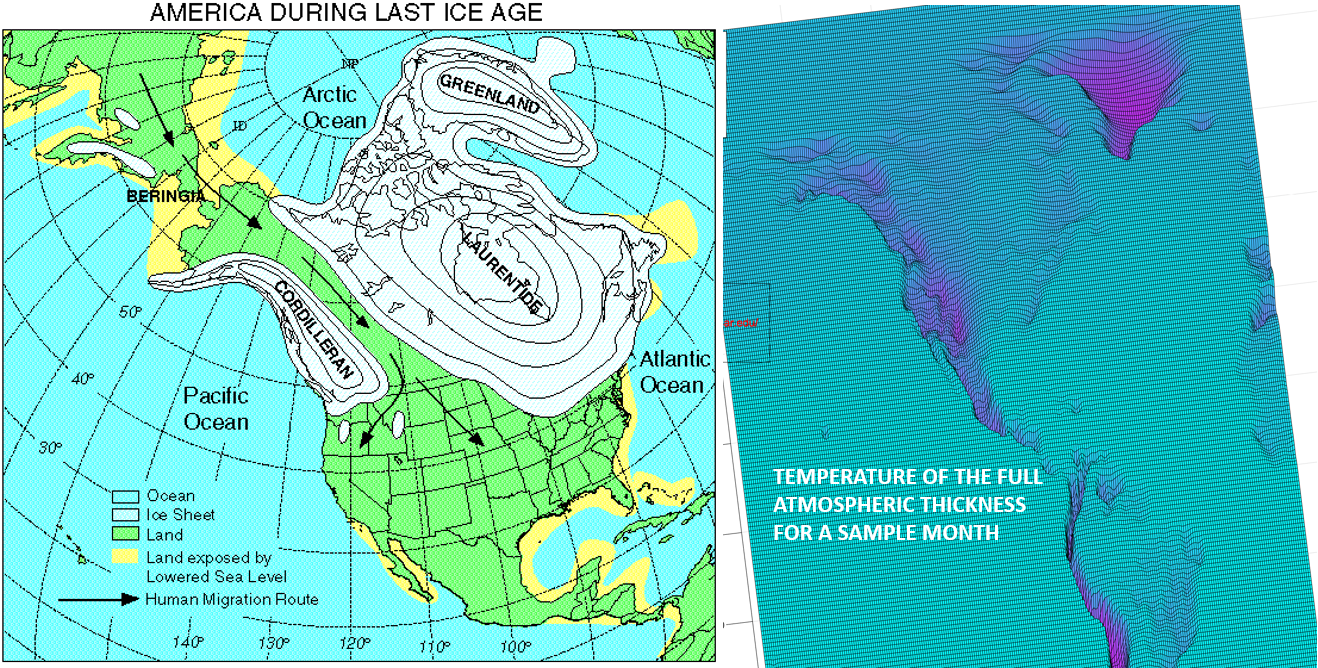
The right panel is a geostrophic representation of temperature (T) for the full atmosphere for a May month. It is a very interesting parameter in my view especially because the high T mound above low-lying Hudson Bay. The comparison supports the existing interpretations of the Laurentide ice sheet. In short, that ice mass flowed into the Hudson Bay and filled it, even though the bay was relatively warmer. As ice accumulated and rose there and along other topographic highs, it continued to spread (flowing) to lower and warmer regions that surrounded it to the west, the southern limits shown. Meanwhile a hotter Sun continued to drive even more moisture into the atmosphere from the still warm oceans. And some of that added moisture would accrete into glacial storage, thereby lowering the ocean levels further. Perhaps Coriolis forces played a role as well, but I’m only thinking out loud.
It is remarkable to me to see from a few spot checks how this notion seems to not be easily falsified. In fact I probably should not be surprised and perhaps you shouldn’t either. After all, imagine how much energy it would take to remove so much water from the ocean and transport it all to mega glaciers. I am going with this notion for now, that it took more Solar Energy to make those glaciers grow, not less.
Another logical consequence would be that as TSI is reduced, seas could rise. Does that mean that a cooling Earth would be more likely to experience rising ocean levels? That would be the opposite of conventional wisdom. I love this puzzle myself. I certainly agree that following any ice age, the seas rose. But I think the explanation posed above is actually more consistent with hydrology than the conventional explanation.
I try to follow examples of others and to be my own hardest critic, so I’ll continue to study. I and hopefully some others might learn more and more quickly if we could come up with a plausible and reproducible understanding of where and whether our global land ice is currently relatively stable, or expanding or contracting in the first place. My recent publication [3] already shows that everyday precipitation does correlate to solar cycles, so I’m optimistic that glaciers, which derive from precipitation, will be found to correlate as well as that newest link advances.
References
[1] https://www.nasa.gov/feature/goddard/nasa-study-mass-gains-of-antarctic-ice-sheet-greater-than-losses. Noting an actual study was mentioned but only a broken link is provided.
[2] http://www.glims.org/RGI/00_rgi60_TechnicalNote.pdf
[3] https://www.tandfonline.com/doi/abs/10.1080/02626667.2019.1567925?scroll=top&needAccess=true&journalCode=thsj20
[4] Hoffmann, G., Jouzel, J. , and Masson, V. 2000. Stable water isotopes in atmospheric general circulation models. Hydrological Processes. 14. 1385-1406.
[5] Thomas, E.R. and Tetzner, D.R. 2018. The Climate of the Antarctic Peninsula during the Twentieth Century: Evidence from Ice Cores. Chapter in Antarctica – A Key to Global Change. IntechOpen for the British Antarctic Survey lith@bas.ac.uk
 8987total visits,4visits today