Temperature, Moisture and the Weight of the Atmosphere
In this post I am simply sharing a widely understood but poorly distributed view that in addition to any solar radiant forcing, the weight of our atmosphere and its moisture contents are the primary determinants of its temperature over a planetary scale. Over a geostrophic scale, the additional widely recognized circulation factors come into play. As part of my UNM research I find that in accordance with basic thermodynamics, other than the mass fraction of moisture and the weight of the atmosphere, relative IR absorption properties of the gases are not significant contributors to an atmosphere’s temperature fluctuations. In addition to many examples, one can also consider that there is no applicable CO2 equation integrated into the already highly accurate psychrometic tables and related which are routinely used to calculate temperature.
Standards including the Beer Lambert Law, Kirchoff’s Law, and collisional broadening are a few of several physical and chemical laws that can be explored by any proficient student to understand the extinction of absorbed radiation. IR and other fields of spectroscopy are only successful because energy emitted from gas molecules will virtually always occur at a longer wavelength than the absorbed energy. Through their ability to map and differentiate between absorbed and emitted radiation, and to filter for other contributions such as Rayleigh scattering, IR spectroscopic techniques have been routinely applied for over a century in identifying elemental gas components of selected planets, stars, and other celestial parcels.
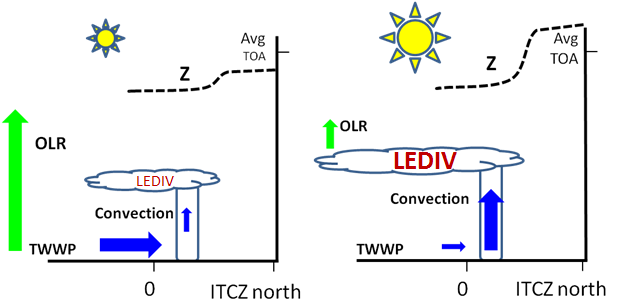
Although IR spectroscopy is cited within greenhouse gas literature as a foundation, the greenhouse gas notion attributes a narrow zone of their longwave absorption bands as an outsized controller of the temperatures of planetary atmospheres. In that view, the most significant quantities of atmospheric energy are stored and released through the molecules such as water and carbon dioxide which are IR active. Yet while it’s true that atmospheric moisture stores and releases the lion’s share of heat, virtually all of that can be accounted for by routine latent heat (LEDIV) rather than any greenhouse gas recursive calculation.
Between the latent heat of moisture and atmospheric weight, it is clear that temperatures of planetary atmospheres can be approximated. In addition to the Ideal Gas Law, factors such as e-folding and its cousin the “H” scale, have allowed researchers to develop relative perspectives for the temperature of any planet’s atmosphere. It may be widely known that beyond the inner planets, gas giants are free to exist throughout space and time without regard to distance from any energy source (such as our Sun). The outer planets Neptune and Uranus appear to point in that direction, if only through comparison of current information regarding their size, gas compositions and temperature-pressure profiles. They are comparably sized, their gas compositions are remarkably alike, and their temperature profiles are similar. Yet Neptune is roughly half again as distant from the Sun as Uranus and happens to be slightly warmer. In the figure below from NASA, the relative sizes and colors of the planets are indicated at the top and the relative distances of each planet from the Sun are illustrated behind that. Uranus and Neptune are the two bluish orbs to the right.

source NASA
.. from rocky planets to gas giants to stars, the impact of gravity upon temperature is clear, whether fusion is evident or not
There might be an abundance of gas giants light years from any star. The gravity and the thickness of the atmosphere leading to sufficient temperature can be invoked to explain why the gas giants are not frozen ice balls in such cold empty neighborhoods of space. Complementary consideration of brown dwarf stars, their similarity to gas giants and their anticipated relative abundance in the universe add “weight” to the notion. As one considers a continuum of sizes of objects from rocky planets to gas giants to stars, the impact of gravity upon temperature is clear, whether fusion is evident or not.
Even after the greenhouse notion is set aside, there are still some basic challenges to better estimation of the distribution of temperature across the volumes of a planetary atmosphere. In addition to eddies and gyres and their local impacts, temperature inversions with elevation within the atmosphere can be encountered. These are often mapped as a boundary layer such as a stratopause or a tropopause. Yet authoritative resources that promote the greenhouse gas notion appear to universally and arbitrarily describe a tropopause for both Venus and Mars even when no inversion can be found. The image below is an example of charts of three associated planetary atmospheric profiles from a related academic source. 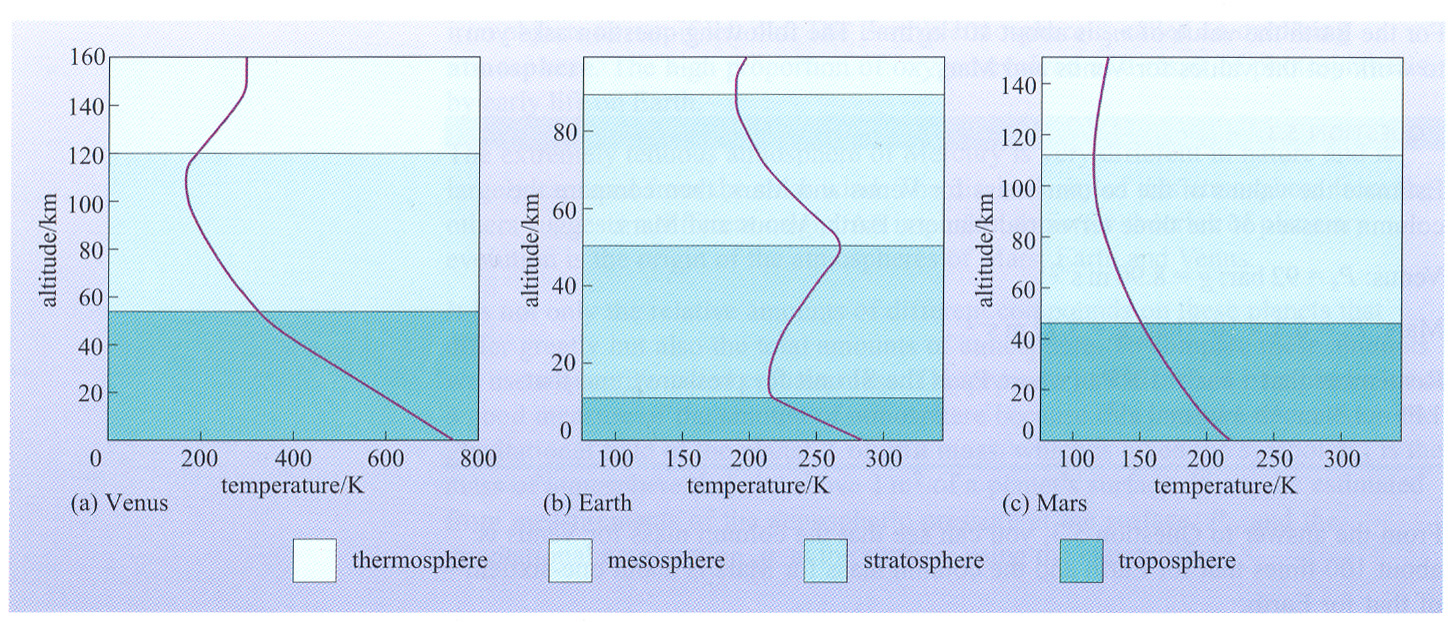
Source for image: http://lasp.colorado.edu/~bagenal/3720/CLASS14/14EVM-5.html
Of these three examples, only Earth indicates the signature temperature inversion associated with any tropopause. On Earth, such an inversion appears to be strongest when the atmosphere is relatively moist. Other planetary atmosphere profiles may express inversions that are similar to a tropopause, but those would merit different names according to the chemicals which are changing state or which are undergoing other transformations. For example, the mesopause represents the beginning of a layer where no gas component is homogeneously distributed.
Depending upon the resource, contemporary atmospheric spectroscopy describes various stripes and intensities of “atmospheric window” panes in the IR regions of their spectra. These open panes are spans in the wavelength spectrum that allows direct escape of emitted longwave energy from the Earth’s surface and atmosphere to outer space without further absorption. It may be that for any photon that is emitted from an IR – active gas molecule, the entire world’s atmosphere, from its bottom to the top, becomes an IR – open window pane. That atmosphere does however exert a heavy weight, and along solar forcing, geostrophic circulation, and the state-changing latent-heat transferring moisture component, our temperatures will always be easily understood and calculated.
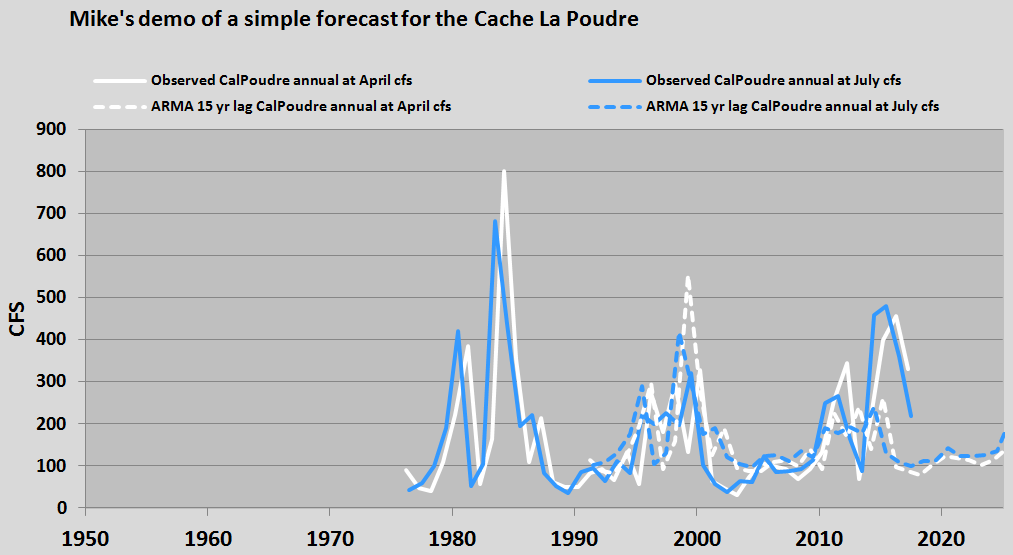
About the featured image: This chart is a product of mine used to explore conceptualizations of changes in atmospheric weight and moisture content as a function of changes over time in the total solar irradiance (TSI). For more information the best current resource to visit is at:
Wallace, M.G., 2017, Application of Solar – Tropospheric Connections Towards Improved Forecasts Of Streamflows In The Western US. in review at Hydrological Sciences Journal. https://www.researchgate.net/publication/318322662_Application_of_newly_identified_solar-atmospheric_connections_towards_improved_forecasts_of_streamflows_in_the_Western_US DOI: 10.13140/RG.2.2.18264.19203
* See Reference page for additional details
 4838total visits,3visits today