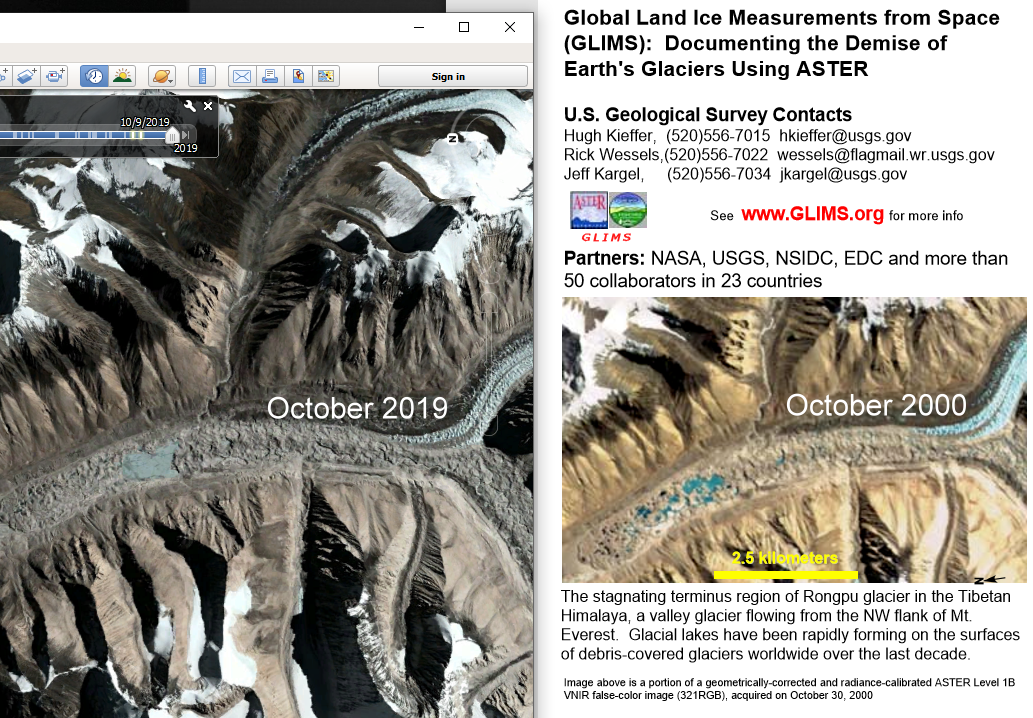
Not to be glib, but the featured image compares a glum 2000 GLIMS assessment [1] of this glacier on the flank of Mt. Everest, to a new snapshot that I just extracted from a Google Earth coverage of the same glacier, at the same month but nearly 20 years later (2019). There apparently has been little if any further glacial retreat. This is interesting because the scientists originally asserted that they were documenting the demise of Earth’s glaciers.
Now apparently with somewhat more restraint, the Global Land Ice Measurements from Space (GLIMS) team has omitted that glum headline. Today they are only “Monitoring the World’s Changing Glaciers”.
In any case, as their Randolph Glacier Inventory (RGI) documents, there has been no statistical shrinkage or growth of the Earth’s total extent of icy patches between 2014 and 2017 [2,3]. Of course that is only a few years but those are the spanning years I could quickly access from their main RGI data page [4]. The first reference notes that the RGI is a “globally complete inventory of (roughly 200,000) glaciers”. The paired images below come directly from the RGI [2,3] references, and with the help of my blue annotations, provide a means to compare the total interpreted areas of ice for those two years. In 2014, they estimated the total area to be 726,792 square km. In 2017, the area was estimated to be 705,739 square km.
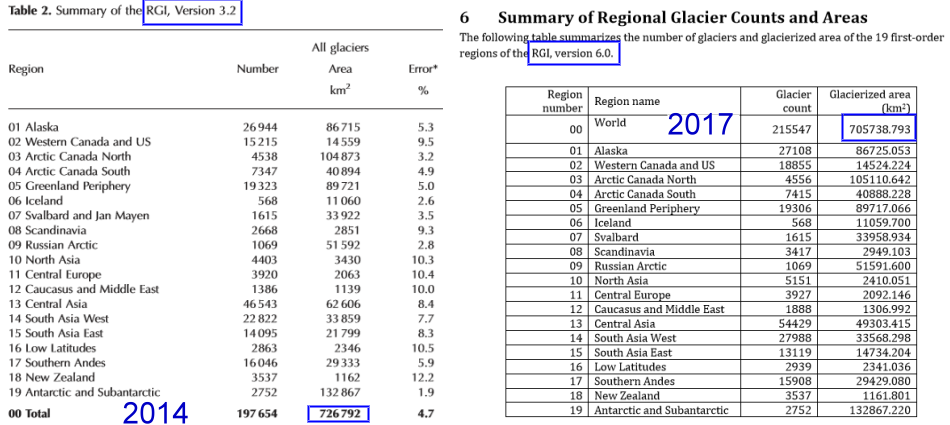
The difference is 21,053 square km. That’s nominally a decrease in area over time, of course. Yet the error for the first year is indicated to be 4.7%, which equals 34,160 sq. km. Since the area of the error is greater than the difference between the areas from the two years, one would have to agree that there is no statistically significant difference between the glacier coverages of the two years.
The condensed tables also allow for comparisons of the major glacier regions. I recommend that any who are curious about glacier growth and decline consider further quick review of the two references. They are very straightforward and helpful, so neither glib nor glum. On the other hand, it would be most appreciated if the site provided a simple table at the very front page to chart the progress of global glacial growth and/or decline, starting in 2000 at the latest (given their glacial promotion in the featured image) and continuing to the present day.
This web site focuses on solar cycles and hydroclimatology. It includes several additional glacier posts under the category of Polar Hydroclimatology. Many of those posts point to other examples where glaciers are now acknowledged to be growing, or at least, not shrinking.
References
[1] http://www.glims.org/Publications/AGUPressConf2001.pdf
[2] https://www.igsoc.org/journal/60/221/j13J176.pdf
[3] http://www.glims.org/RGI/00_rgi60_TechnicalNote.pdf
[4] http://www.glims.org/RGI/