Experts routinely assert that polar ice extents each September capture something critical, dire, and apparently obvious about global temperature trends. But none of that can be reconciled with some observations which actually are obvious:
When winds* diverge from the polar center, then a broad ice cap occurs. When winds converge towards the pole, then the ice cap shrinks.
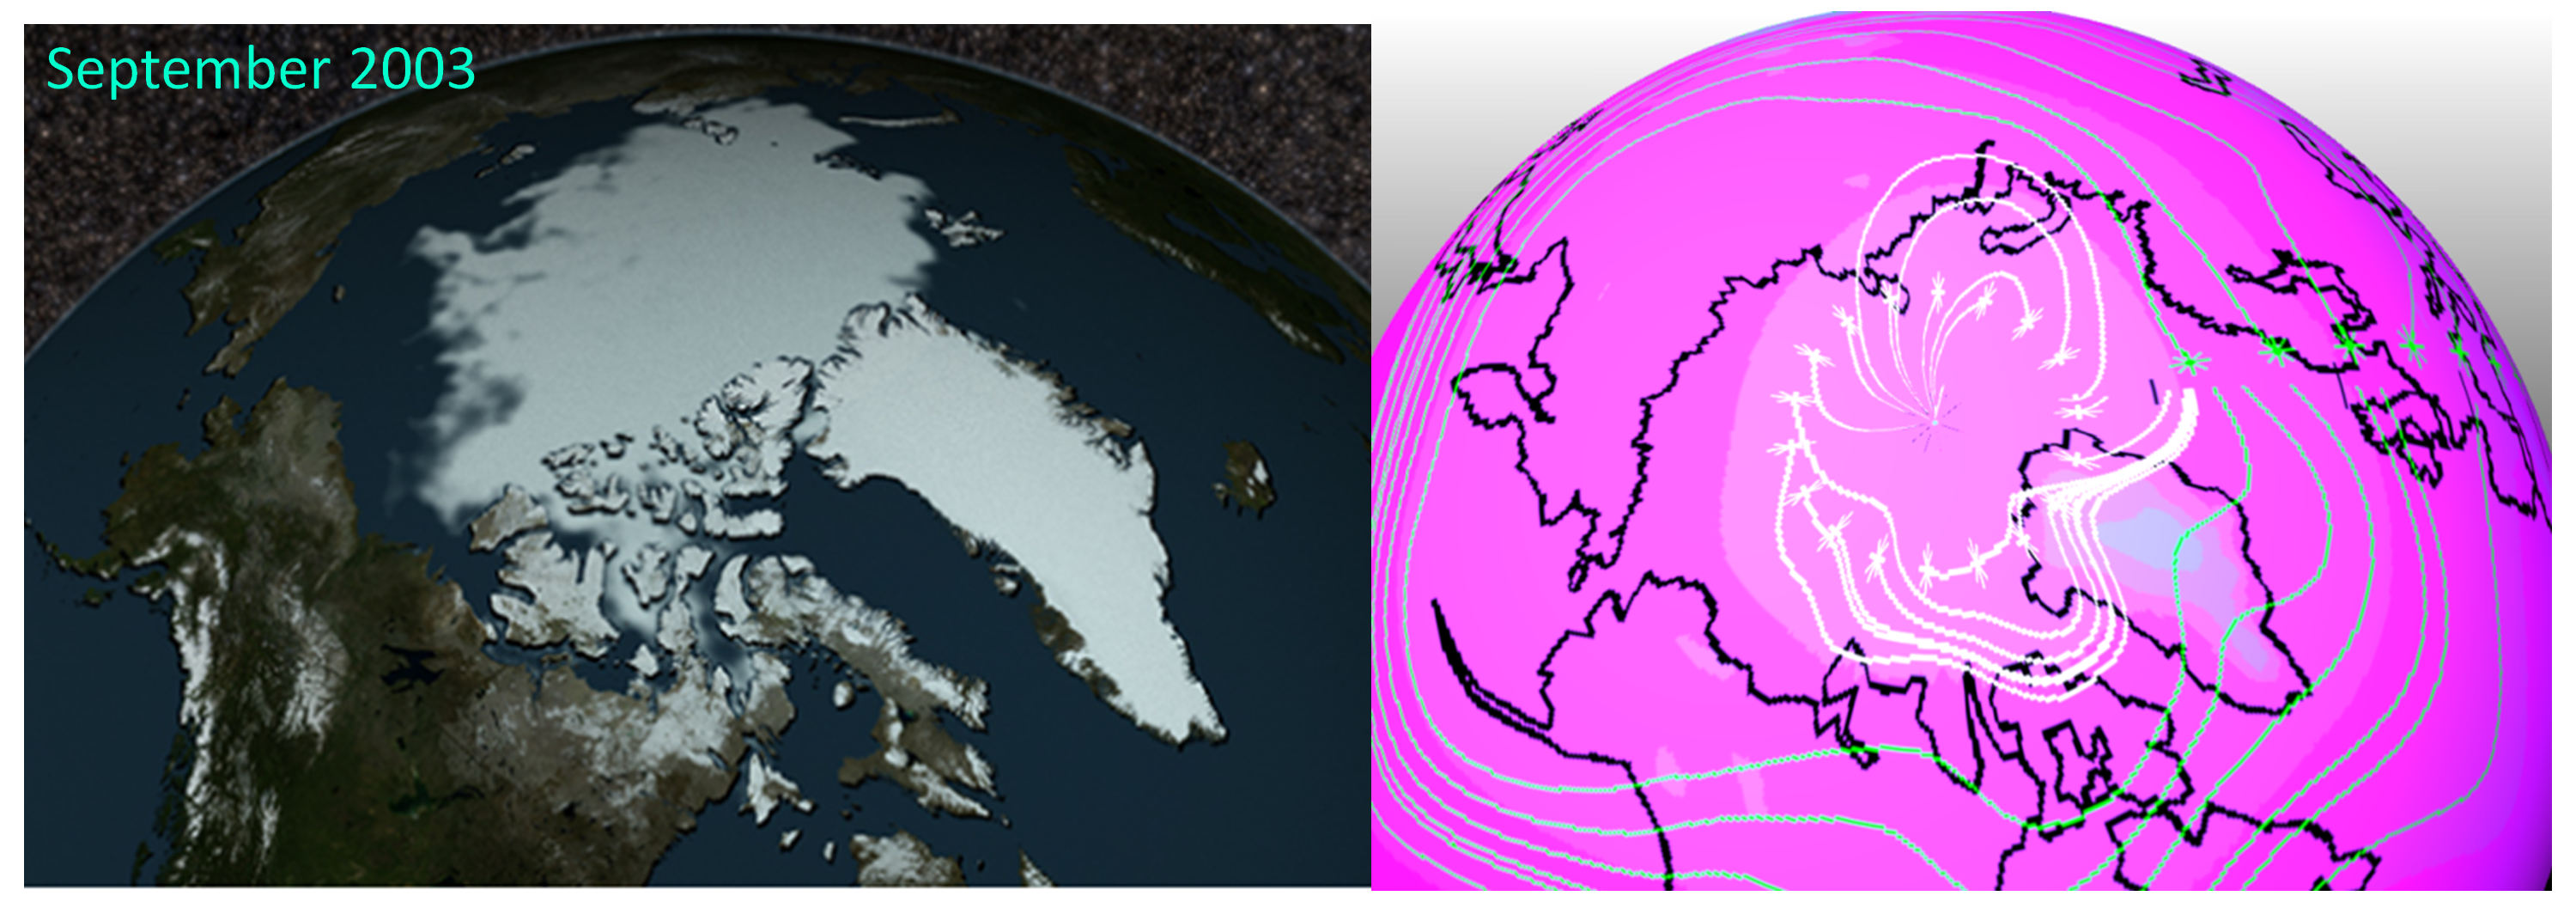
This simple featured animation, along with the two slides below, help to demonstrate. The polar ice extent is relatively large in 1979 and relatively small in 2003. In the frames below, from an earlier post, I’ve used Geopotential Height (Z) as the scalar magenta-heavy field. In the featured animation above, I’ve used Temperature (T) instead, and have added some streamlines, so somewhat less is left to the imagination.
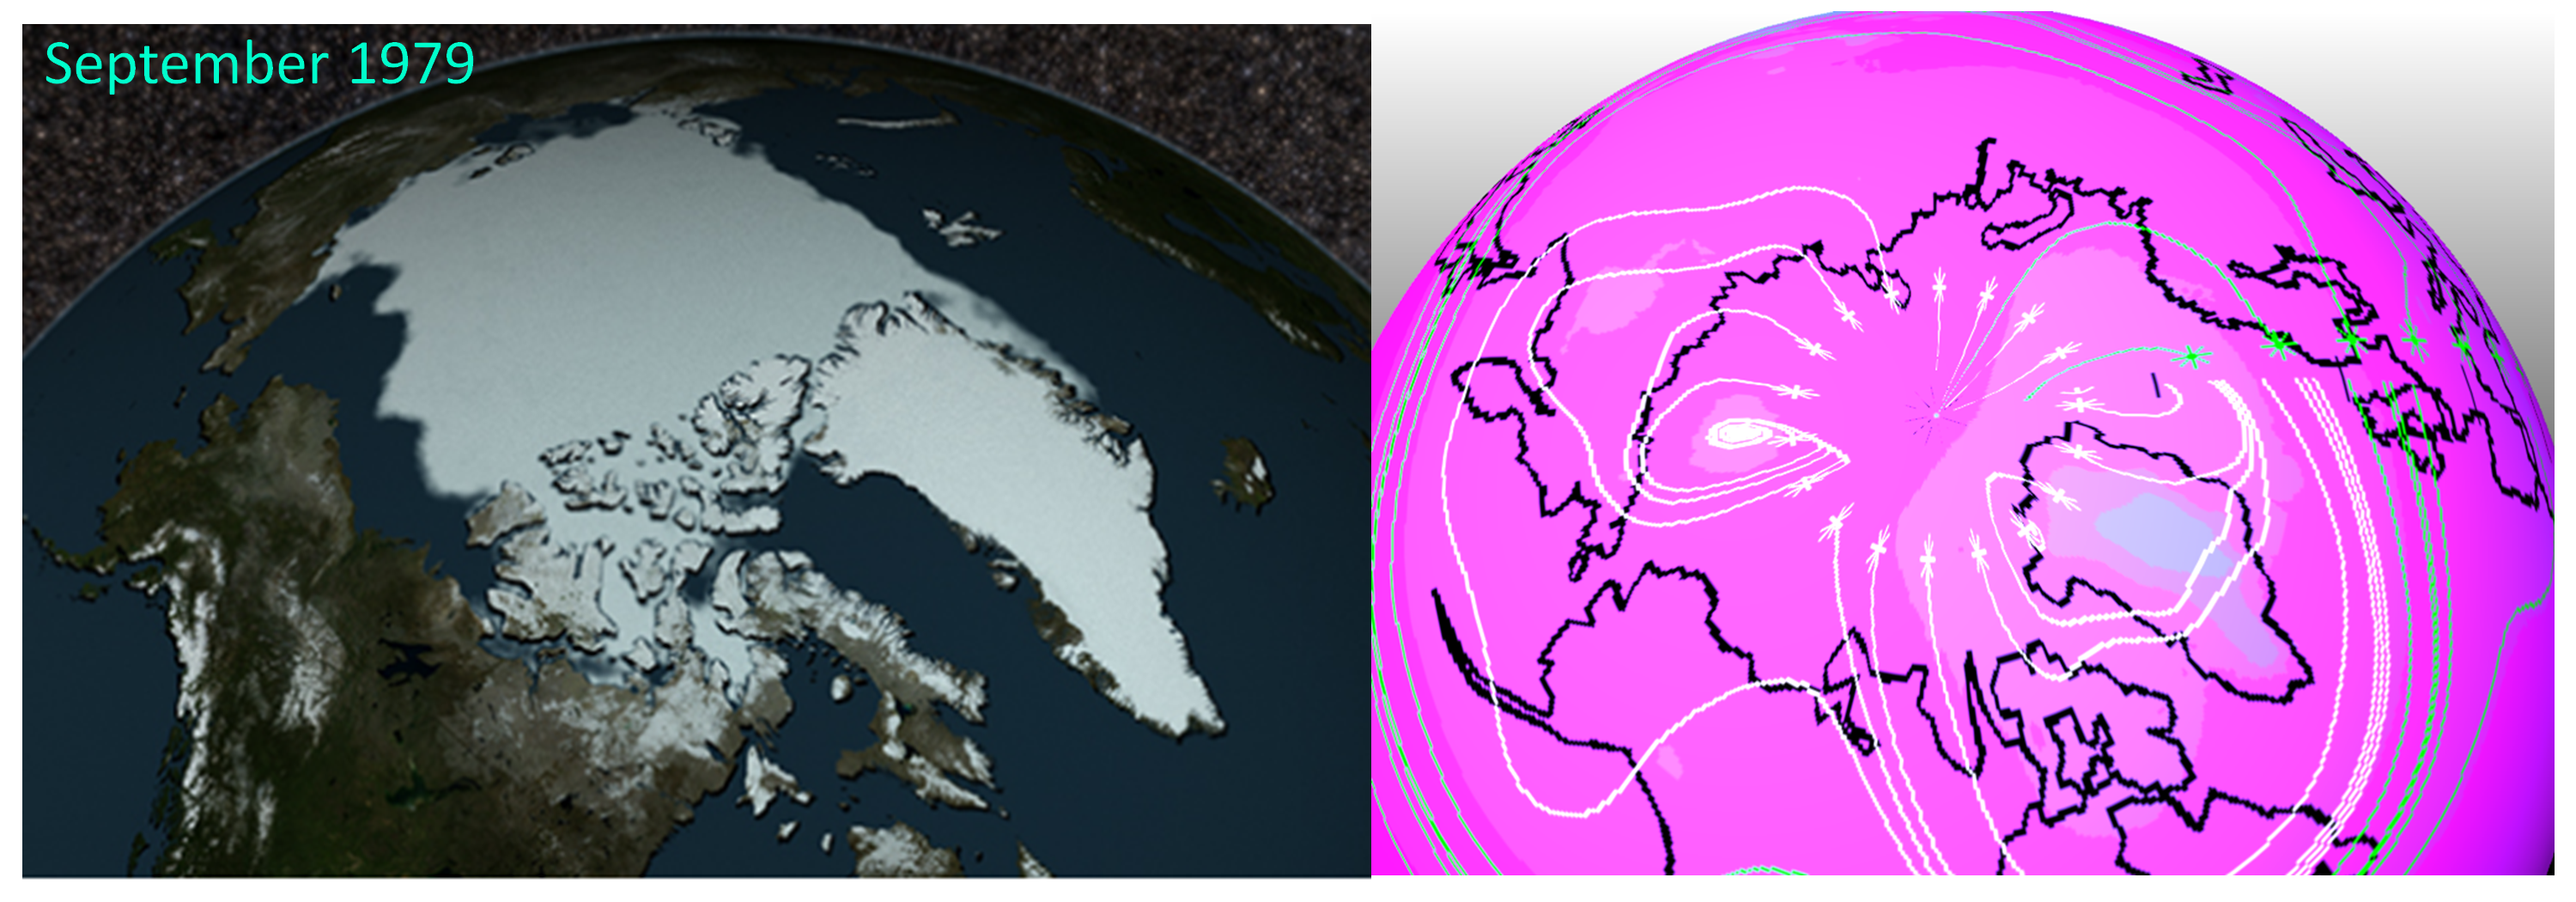
In the natural color mapping for temperature, the warmest colors are the warmest temperatures, and the coolest colors represent the coolest temperatures. Note that the Z frames are not unlike the T frames in this respect, and that merely reflects the power of the Hypsometric equation, which relates pressure and temperature for any air column.
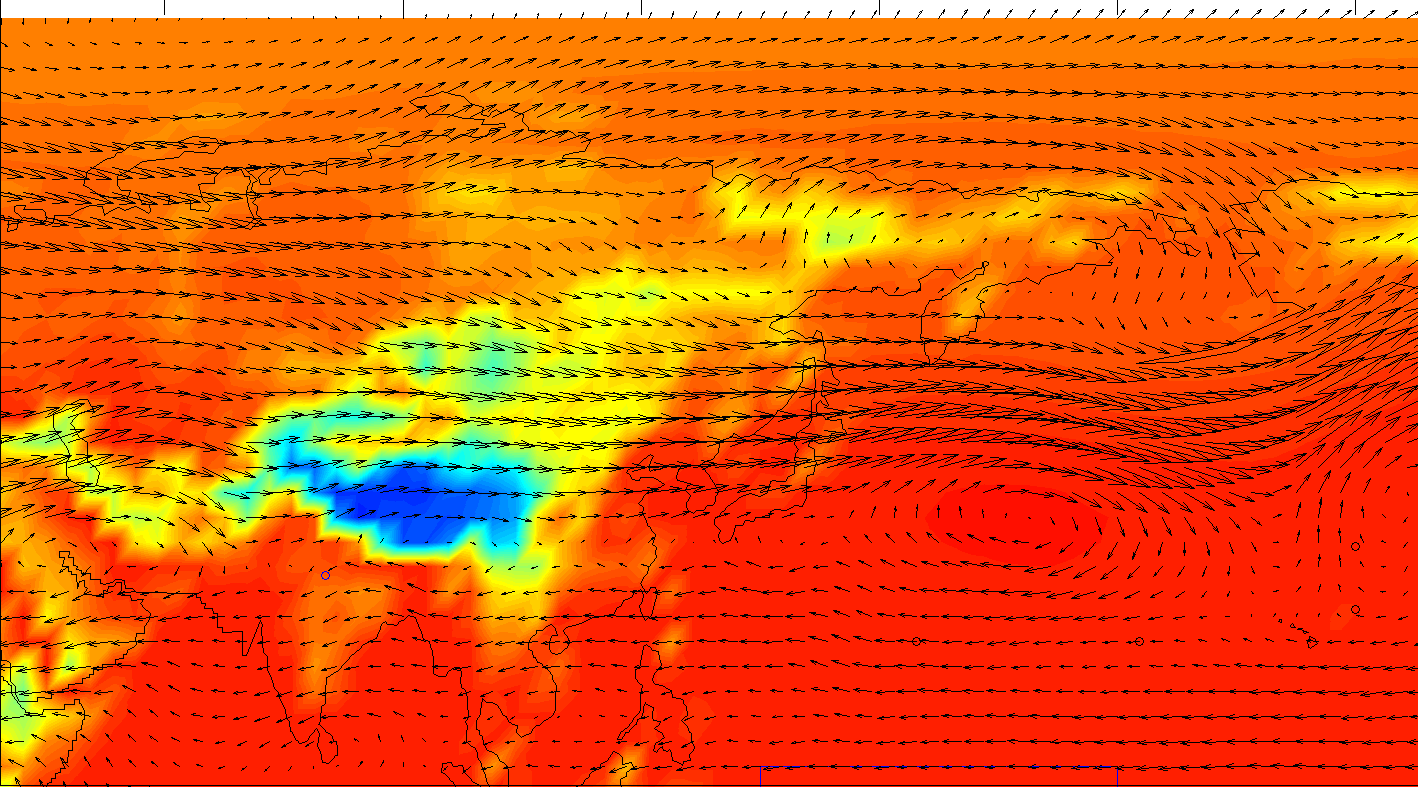
I now have added some closeups of simple wind velocity vectors. I’m focusing on the Siberian coast, because this appears to be a significant ‘valve’ for flows of relatively warm air into the Arctic at times. As any can observe from outside sources as well, this is the area where arctic ice retreats the most, when it retreats.
First, the September 1979 coverage:

September 1979. click to enlarge.
As noted, September 1979 expresses a relatively large climatological icepack, and this figure documents that winds are not rushing into the Arctic from Siberia.
Next, the 2003 coverage:
September 2003. click to enlarge.
And, as noted, September 2003 expresses a relatively small climatological icepack. This figure documents that in this small-icepack case, winds ARE rushing into the Arctic from Siberia.
Some might be surprised as well to see that one can hardly recognize any change in temperature between the two sampled September months, decades apart from each other. There are slight differences of course, and the mapping to the polar view in the featured animation brings this out more clearly. Perhaps other climate scientists can find a way to continue to downplay winds and nonetheless explain why for these two examples, the air temperatures are somewhat warmer across the Arctic footprint when the ice cap is larger.
It is not then surprising that official sources on arctic ice expansion and decline, carefully parse their language regarding climate causality in the arctic. Here is a quote from a recent announcement [1] by the National Snow and Ice Data Center: “Overall, the summer of 2019 was exceptionally warm, with repeated pulses of very warm air from northern Siberia and the Bering Strait.” The article also references high pressure regimes, but includes many more graphs and trend projections of the September ice record over several decades. Some of those graphs are repeated in the same article page, possibly leaving readers to connect the dots to climate change.
In fact, the article makes no mention of “climate change” or “emissions”. My interpretation is that they will not explicitly attribute arctic sea ice fluctuations to those loaded terms. Rather as only logical, the high pressures, and the warm winds can explain**. To repeat, high pressure systems along with associated relatively warm and dry winds, can and are attributed in a low-key way to account for Arctic ice controls in September. So far I haven’t read of any climate scientist attributing high atmospheric pressures to anthropogenic greenhouse gas emissions. For what it may be worth, I have indicated in a paper [2] that atmospheric pressures at least in some important regions, are influenced on climatological scales by solar cycle forcing.
Any are always welcome to correct and/or otherwise comment, but in the meantime, I’ll parse out my own hypothesis through subsequent posts and likely a specific submission to a peer review journal. Here are some loose ends to wrap up for this informal opinion-laden blog post: The Arctic is COLD, so the difference of a few degrees here or there over much of its ice mass doesn’t lead to melting except when the temperature rises above the freezing point. Siberia in September is a relative hot house in comparison. Also the Arctic ice pack is THIN, only a few meters on average. Accordingly it hardly takes much warming from dry winds to erode the ice packs and thereby expand the open waters (polynas). Compare Arctic ice thickness to the mountains of ice weighing down upon Greenland and especially Antarctica.
For the Siberia case I have inferred dryness from the divergent streamlines over that taiga, simply because divergence is often associated with subsidence of dry air (i.e. higher pressure zones). I see that reference [1] appears to support. In effect, just as a Santa Ana Wind pattern can warm and dry out Southern California, these “Santa Siberian Winds” can melt and sublimate the coastal Arctic ice to Siberia’s north. It is also interesting that the Santa Ana and these other winds both favor an autumn time frame.
Returning to the broader Arctic picture in the featured animation, there are some Septembers when winds converge towards the Arctic from every direction and not only from Siberia, and those are low ice pack Septembers. There are also Septembers when winds diverge from the Arctic towards every direction, and those appear to be high ice pack Septembers. I’ve noted in a previous post also that there are some September-years (2005 for example) where air neither diverges nor converges, but rather only swirls around in place. Ice extents appear to be average for those cases, so far as I’ve looked.
Returning to this post, it seems interesting to me that the September temperatures, around the world for these two example years, separated by decades of presumed climate change, are almost IDENTICAL. My next post will add some information on that point. If anything, as I’ve noted, the high Arctic ice September-year displays warmer overall air temperatures than the low Arctic ice September-year. I haven’t failed to recognize that this post led with a quote from the NSIDC [1], asserting that temperatures in the Arctic have been higher than normal. I would say that their associated graphics and their muddy pressure contours as well are not very convincing. And although I like to examine temperatures of the full thickness of the atmosphere (all of the data), they appear to favor a single isobaric level (some of the data), without further explanation.
It’s been a few days since I first began to author this post, and I can’t stop examining the data. I’ve elected to capture the meridional velocities from the 80.5 deg N Latitude. These align with the uppermost row of white stars in the featured images, except now, I’ve examined all 512 cells of that row. I’ve extracted that data for each September of the years from 1979 through 2014 (which is the full 36 years of data that I routinely work from the UCAR source).
For each September, I developed the average wind velocity for that zonal latitude. The greater the negative value, the greater the divergence of winds from the North Pole (more or less). I did not average anything further in time, although I may later for other purposes. Note the units for velocity are in kg/(m s), which is the result of vertically integrating the wind velocities through the full atmospheric thickness, as described in the UCAR ERAI source.
The chart below compares that time series to an equivalent September time series from an NSIDC source [3].
I’m very pleased to report that the full data corroborate, or at least strongly support my hypothesis. I’m justified to make this assertion if only because the Pearsons Correlation Coefficient (CC) is -0.6. Next I’ll add the significance metric.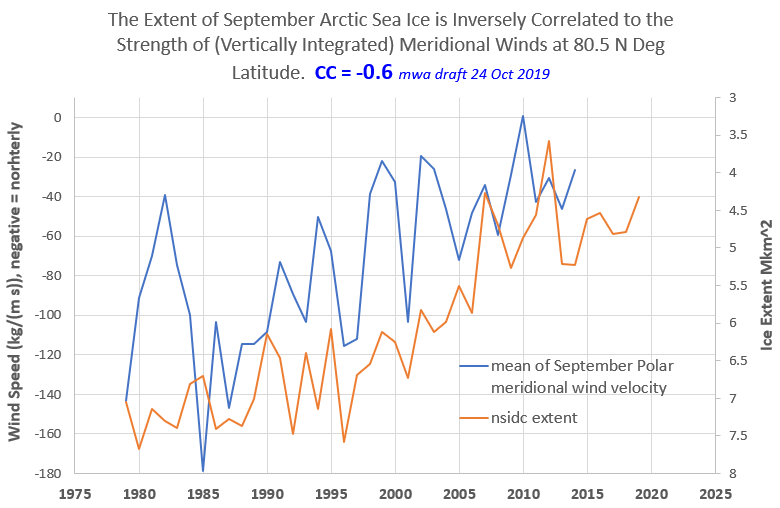
Significance:
N-2 degrees of freedom = 34,
R2= 0.36
p=.00013 Therefore the result is significant at p <.01
According to this methodology, there is a 99% chance that the two series are related and there is a 1% chance that they are not.
MORE TO COME, BECAUSE SOLAR CYCLE IMPACTS SEEM EVIDENT
I’ll be integrating this into work from reference [2], because it seems plausible to me that the recent several decades of decline in solar activity correspond equally well. In a Hadley-grounded conceptual model, as solar activity declines, meridional flows towards the North Pole decline, simply because the driving energy is lower. With less transport to that pole from the upper atmosphere elevations, there is less divergence from that pole across the lower atmosphere elevations. Accordingly, there is more transport of continentally warmed air, within the lower atmosphere elevations, towards that pole, with the result of a smaller climatological September ice cap.
This solar-driven cycle informal hypothesis appears to have the potential to explain the expansion and contraction of the Arctic ice cap (for climatological September, which is the typical month of minimum ice extent). That might be important to explore for many.
I invite you to also visit related Arctic and Antarctic images and animations at the CLIMATE GALLERY page.
Data sources
UCAR ERAI Source: Available from http://www.cgd.ucar.edu/cas/catalog/newbudgets/index.html#ERBEFs
Sea Ice Images: https://climate.nasa.gov/vital-signs/arctic-sea-ice/
References
[1] https://nsidc.org/arcticseaicenews/ October 3, 2019 issue.
[2] Wallace, M.G., 2019, Application of lagged correlations between solar cycles and hydrosphere components towards sub-decadal forecasts of streamflows in the Western US. Hydrological Sciences Journal, Oxford UK Volume 64 Issue 2. doi: 10.1080/02626667.2019.
[3] Sea_Ice_Index_Monthly_Data_with_Statistics_G02135_v3.0 (1) from https://nsidc.org/arcticseaicenews/sea-ice-tools/
* As usual, I refer to winds, temperatures, and geopotential heights for the full atmospheric thickness.
** Did I leave out ocean circulation? Yes I did, and the NSDIC did not. But because of the millenial – long circulation transits of ocean waters, and the rapid response of ice to warm dry winds which circulate around the planet in about a week, I think it is allowable in this context.