Many believe that the North Polar Ice Cap is a suitable, if not awesome surrogate for the temperature of the planet.
There is a simple reason to disagree. Perhaps after some readers review this recent post, they will already be convinced that warm winds blowing north from Siberia may account for most polar ice loss at the critical time it is routinely measured in September of each year. By the same token, as the linked post conveys, when warm winds do not blow across the North Pole, the ice cap doesn’t shrink.
The relation of the polar ice cap to simple geostrophic winds may be amazing. But many including residents of the Central and Northeastern US, will already be intimately familiar with the very same notion; the Polar Vortex. This is the fairly frequent condition when the Northeastern US experiences a frigid cold spell in the winter. We are informed by the climate scientists that this is not global cooling but a temporary slip of the Jet Stream to a more southern boundary, bringing a mass of arctic-chilled air along behind it.
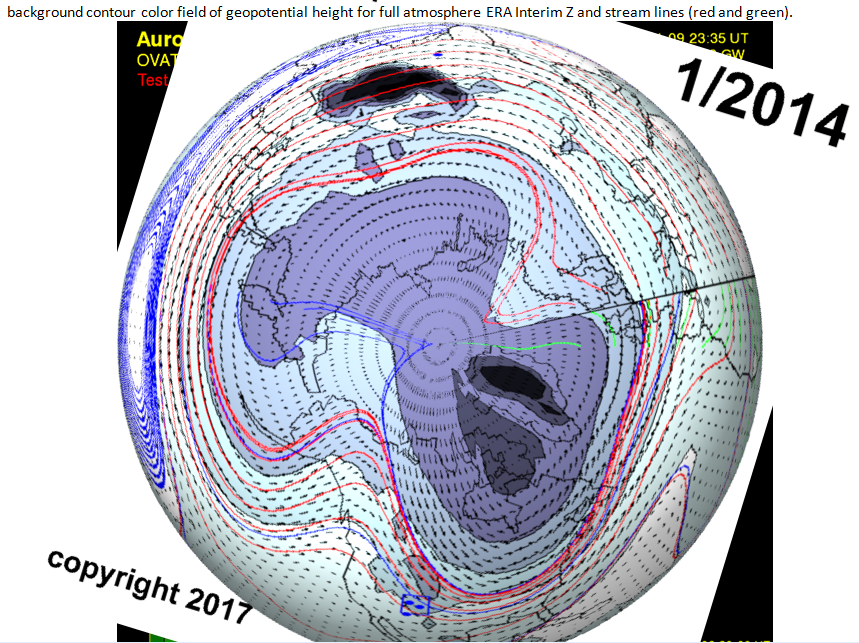
The Polar Vortex of 2014 is easily identified from geostrophic mapping. Geopotential Height contours (generally the deeper the color, the colder the air mass) with streamlines largely in red defining the dipping Jet Stream across North America.
These two claims, which are asserted by the same climate science community are internally inconsistent, and cannot both be right:
When a mass of relatively cold arctic air drops to the south across the northeastern quarter of the US, this is not global cooling. It is a vortex.
When a mass of relatively warm late summer Siberian air migrates to the north across the Arctic, this is not a vortex. It is global warming.
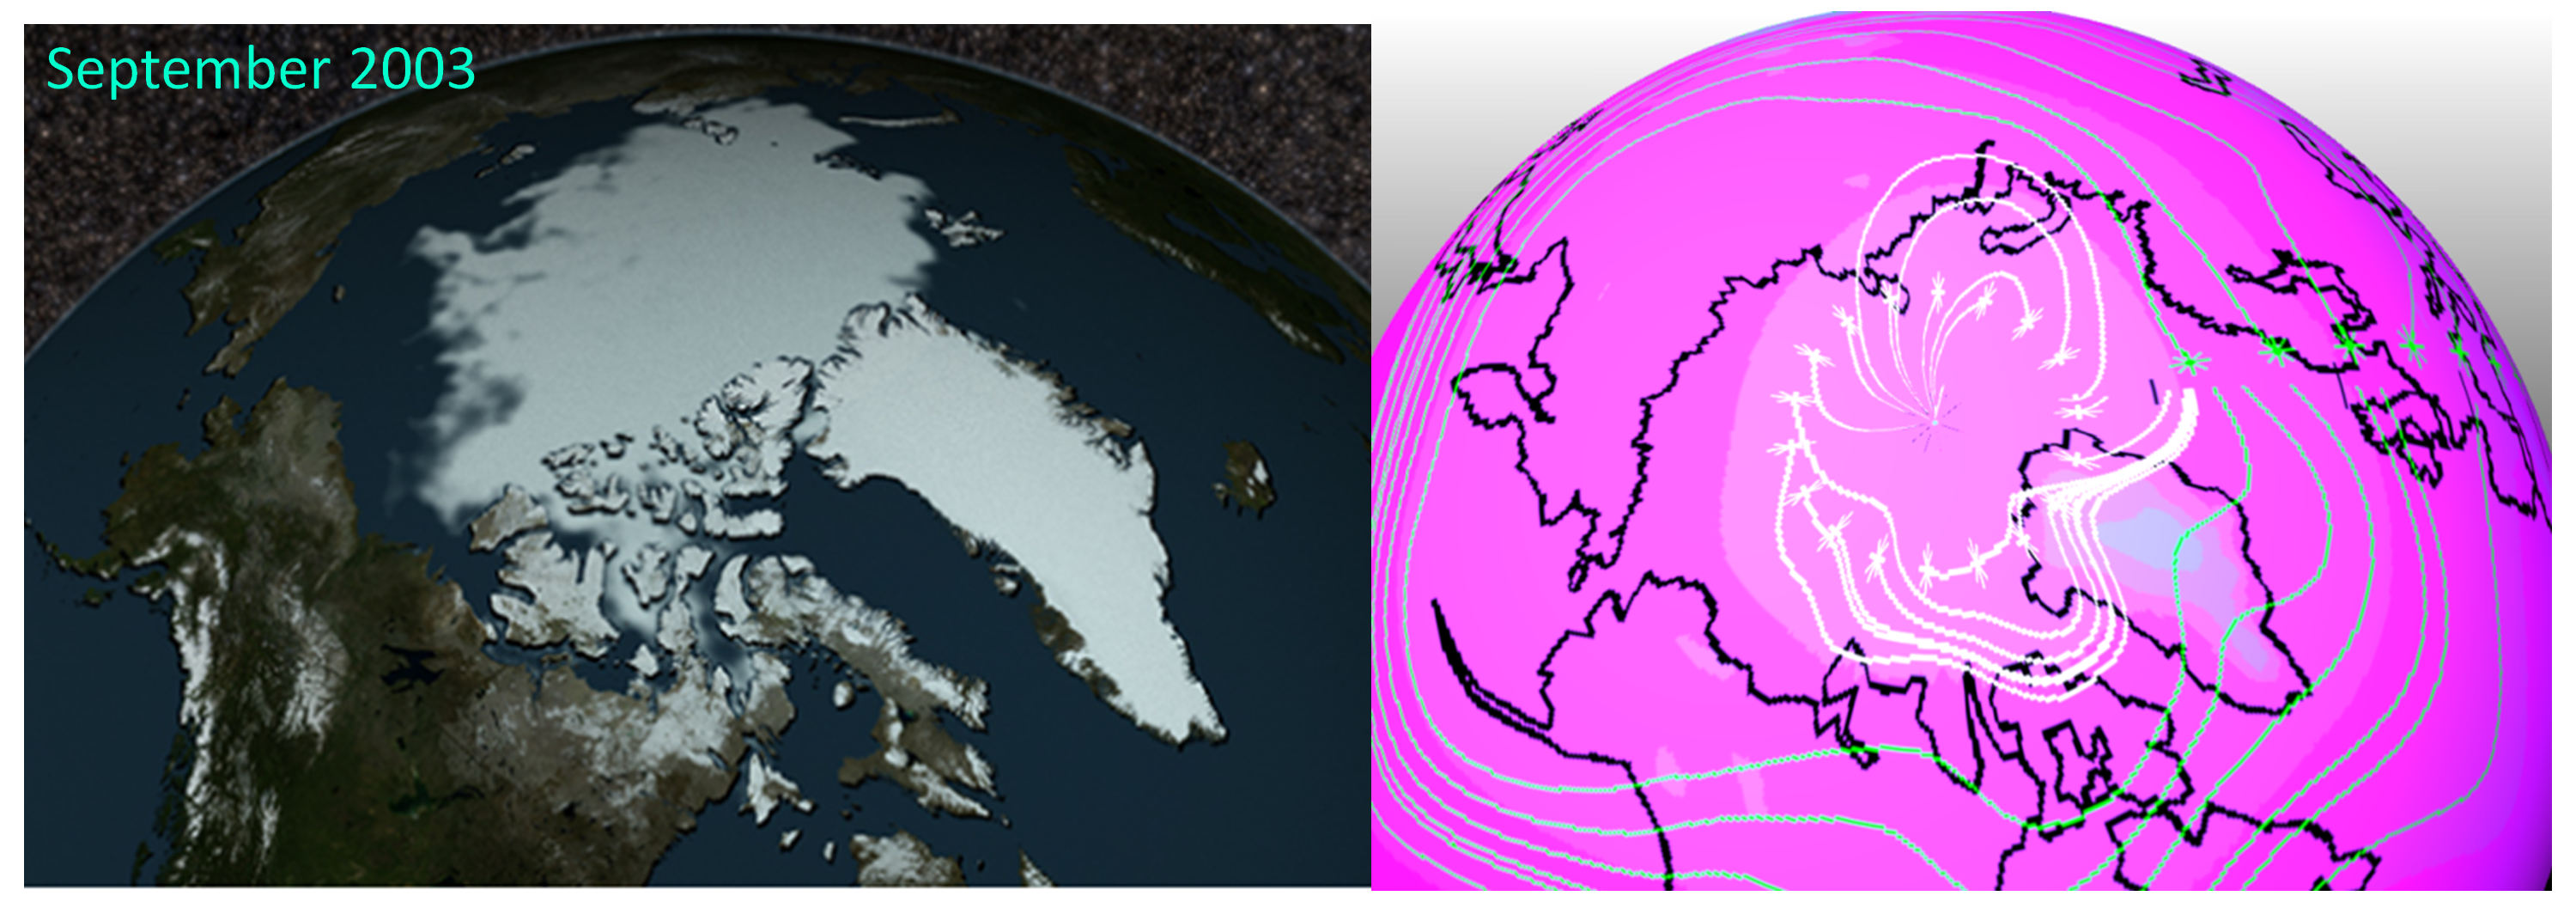
The Anti-Polar Vortex is also easily identified from geostrophic mapping
Accordingly the claims are candidates for challenge, as any self-conflicted theory should be. In the meantime, I’ll continue to study geostrophic moisture circulation because so far, whether regarding polar climate or equatorial climate or ocean patterns or ocean pH or even ozone climate life cycles, the conclusions although controversial, all appear to be very consistent.
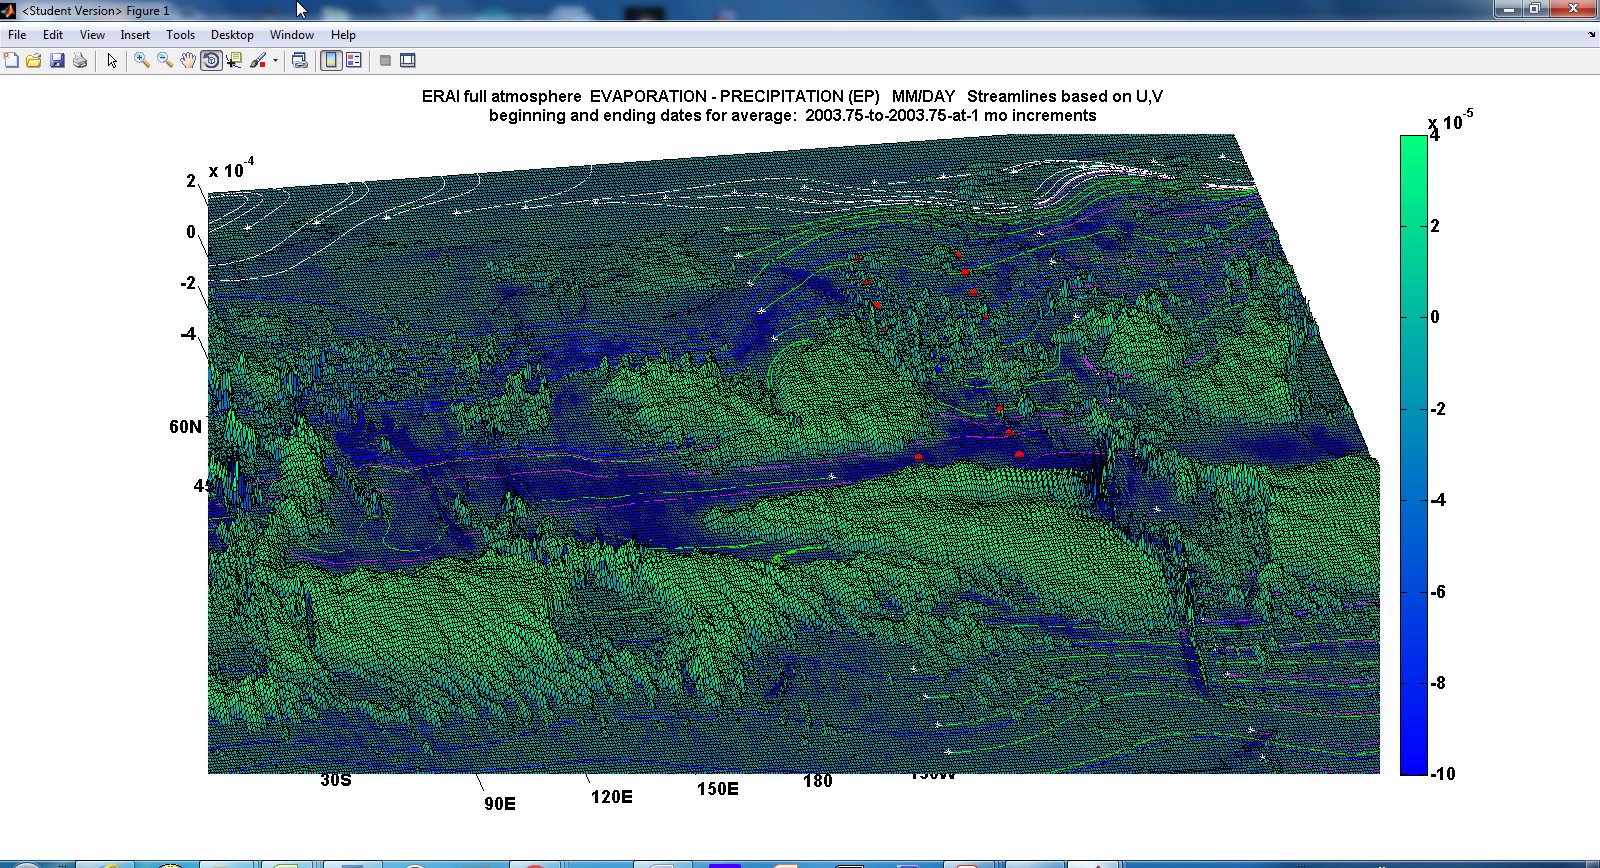
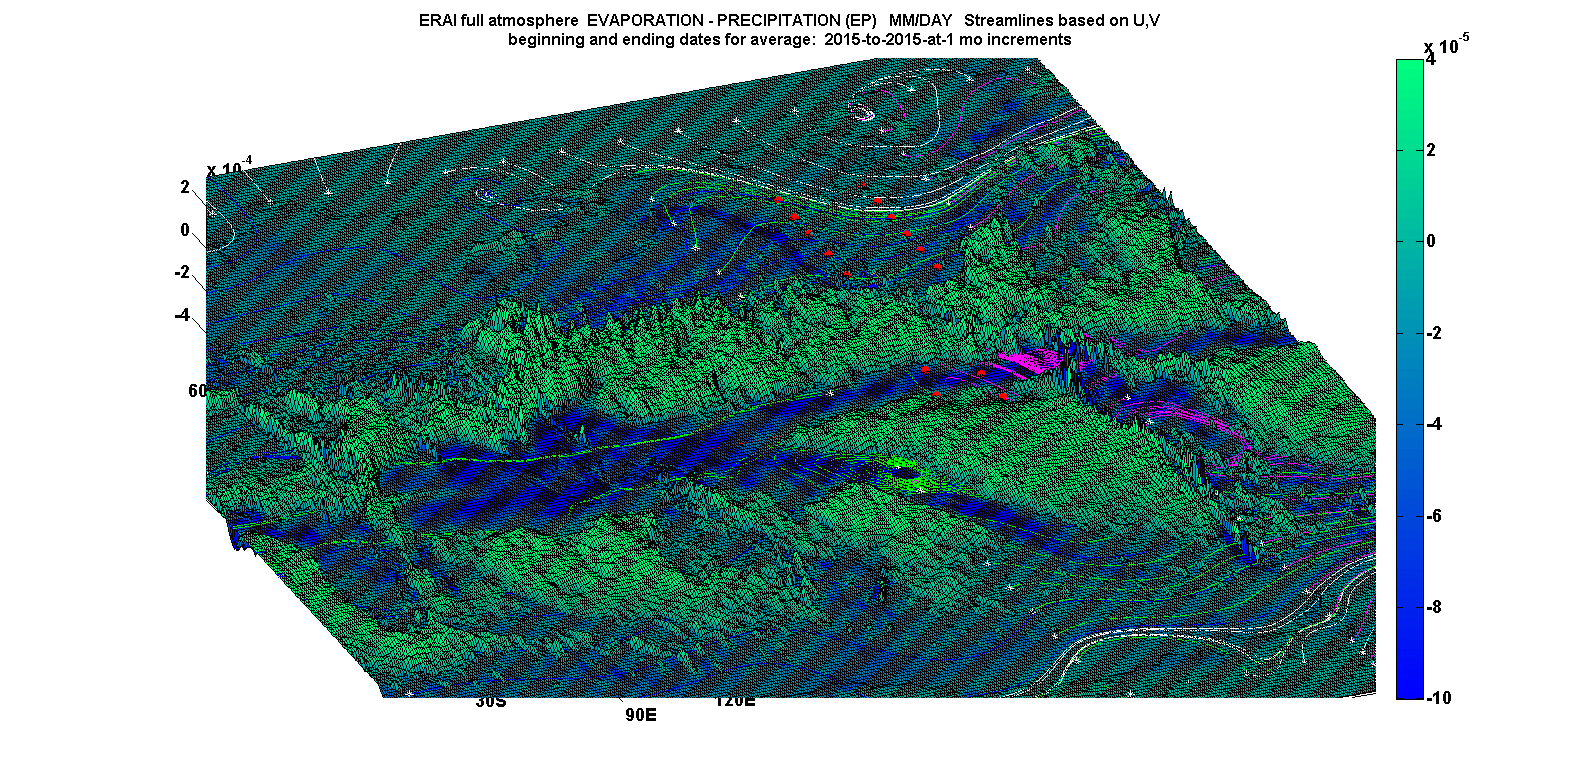
To put that into practice, I’ve added two more views of the same years and months that accordingly include the same circulations. This time I follow a convention I like which includes an oblique view of the Evaporation minus Precipitation UCAR from ERAI parameter. Both the elevation and the color indicate the same thing. The deeper and bluer the surface, the greater the intensity of atmospheric moisture. The circulations and the moisture “waves” are apparent for the polar and the “anti-polar” vortexes, among other interesting features.