As I might have mentioned, quantitative analyses of virtually any past major weather event or moisture/drought pattern seems almost effortless through the QG approaches featured by my business. This web site includes relevant examples ranging from cyclones to jet streams to the Polar Vortexes, Rossby Waves, and the AMO. In this post I take a preliminary look at the popular El Niño and La Niña components of the so called ENSO index, and compare to the QG Continuum. My first example is based on a long information piece at:
http://www.goes-r.gov/users/comet/tropical/textbook_2nd_edition/print_4.htm#page_1.1.0
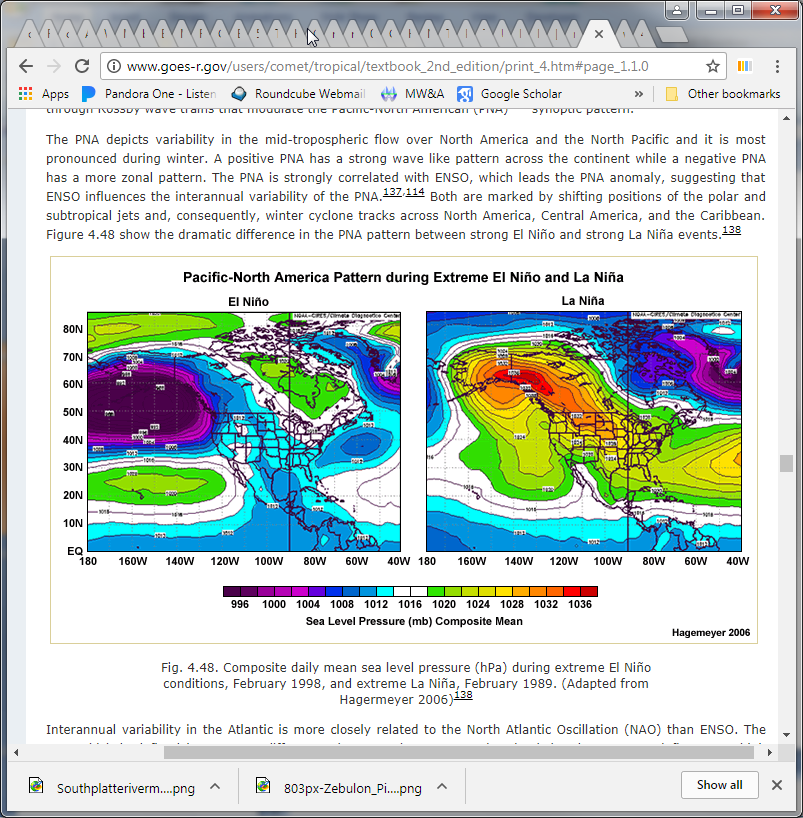
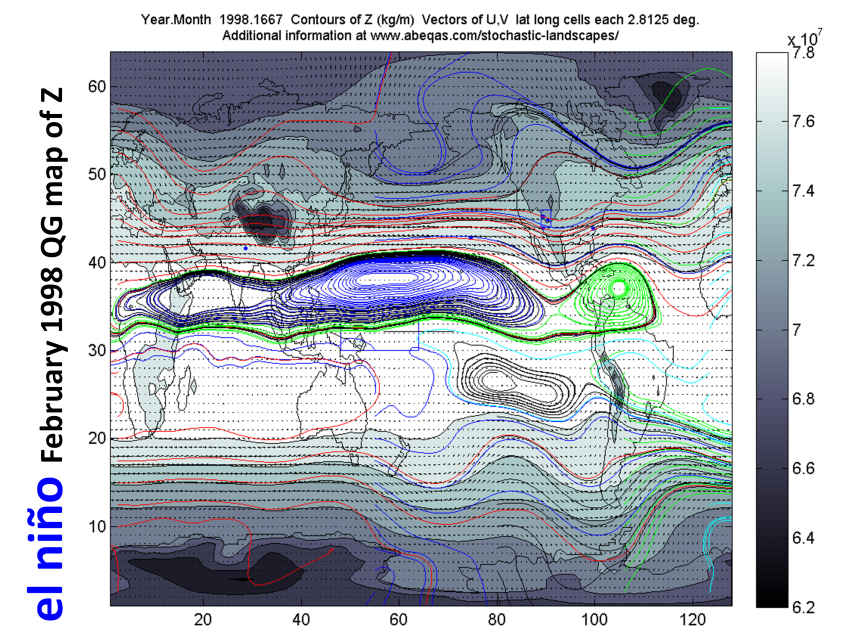
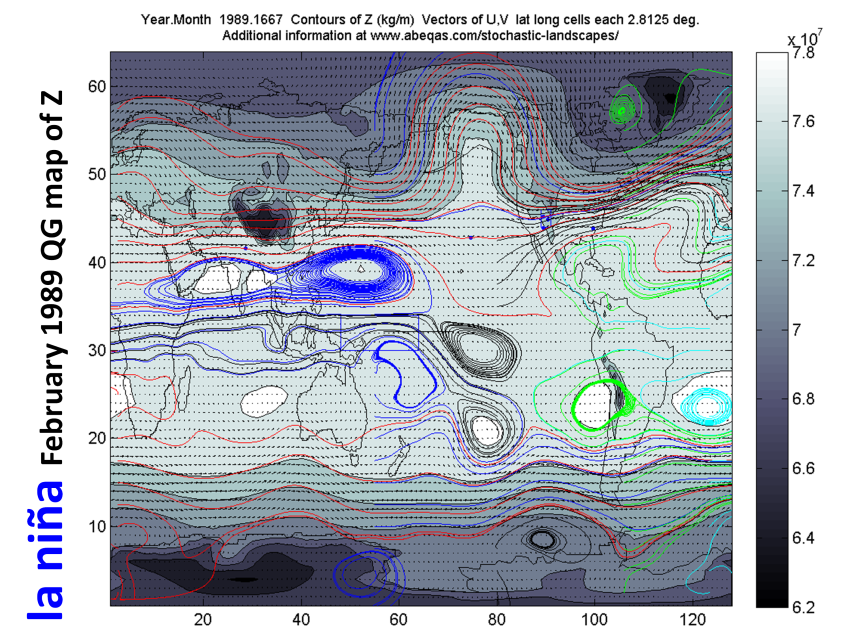
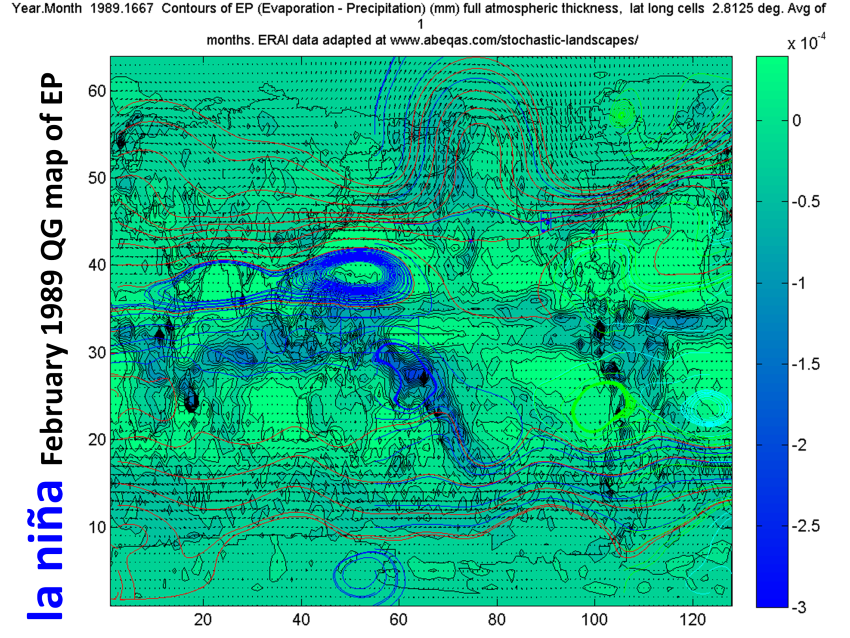
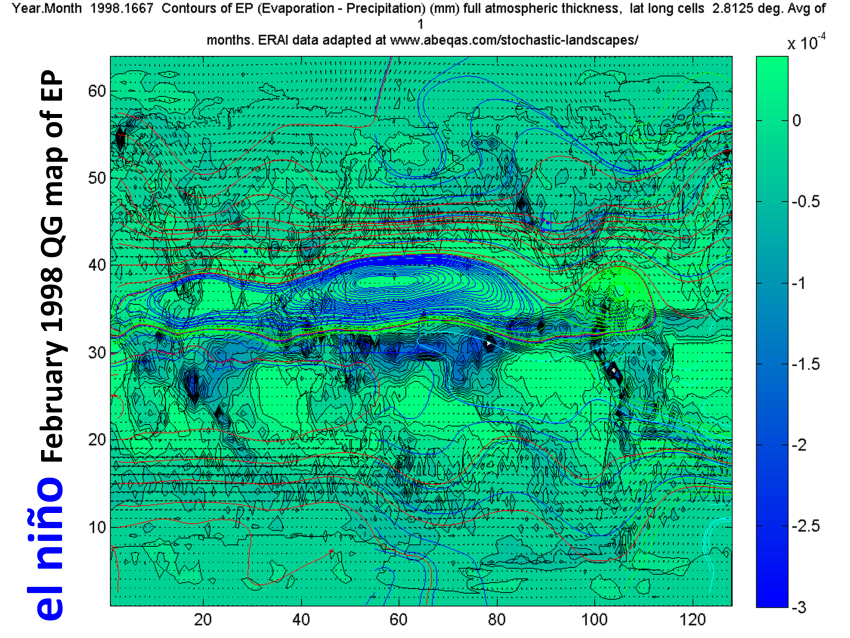
I’ve clipped this image from that page, which shows surface pressure Pacific North America (PNA) patterns associated with an extreme El Niño in Feb 1998 and an extreme La Niña, in Feb 1989. I’ve then extracted two of the three standard stochAtlas coverages for the same months and reproduced those maps for easy comparison to the ENSO features shown above.
Clearly the QG approach also captures essential ENSO patterns based on the reference image. However QG also captures other features which may go far to explain the current failings of ENSO forecasts in some circumstances. In particular, this appears to help explain the failures of El Niño / La Niña switched forecasts regarding the recent emergence of regions of the Western United States from drought. I discuss such features at current talks. See the bio page for pending presentations in 2017).