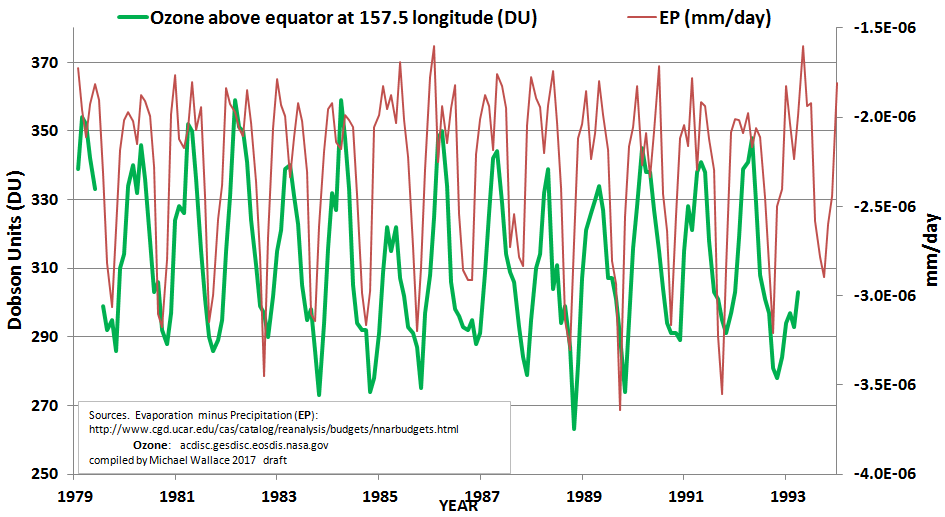
In my most recent post, I explored whether ozone might be related to moisture in the atmosphere (and the associated congruence of marine aerosols). I believe the featured image confirms this. For part of this time series comparison I selected the rough center of the Western Equatorial Pacific. This region has been profiled many times at this site and is a nucleus of work I currently have in peer review exploring solar causation of patterns of atmospheric moisture and continental streamflow.
The featured image compares ozone over this footprint directly against the atmospheric moisture parameter termed “Evaporation minus Precipitation” (EP) over the Tibetan Plateau. The visually striking correspondence is confirmed by a simple calculation of the correlation coefficient (CC) between these two sets. It is equal to –0.56, which, given the 171 pairs, is significant at the 0.01 percentile. This is nothing but extraordinary for a monthly correlation between two nominally independent parameters.
Please note the sometimes confusing reversal of axes I often apply. I reversed the axes of EP to exemplify the good fit visually. But it’s also important to keep in mind that for the EP parameter, the more negative the value, the greater the value for atmospheric moisture. Accordingly the featured image shows that as full atmospheric moisture increases over the Tibetan Plateau, the full atmosphere ozone decreases, at least over the Western Equatorial Pacific. I’ve compared these simply because of an accidental observance. I don’t presume to know at this point why those two zones show such an interesting correlation. All I know at this time is that they do. I hope to learn more and continue to review various data sets as I can.
Ultimately I hope to understand more clearly what causes the destruction of ozone and what facilitates its production. Regardless of the sign of the correlations, the strength of the correlations between ozone and water vapor are hard to discount. One wonders how industrial CFCs and/or Halons would score from an Ozone correlation standpoint. Some answers might be found within one of the most comprehensive reports available on ozone by the World Meteorological Association (WMO), which represents as a scientific assessment of ozone depletion [1].
The vast document includes much useful information no doubt, but also appears to include inaccurate claims. For one example, it asserts that Arctic ozone concentration declines in the boreal Spring. My own development of their data contradicts that conclusion and demonstrates that the lowest levels of Arctic ozone are to be found in the boreal Autumn, just as found for the Antarctic*. In another example, given what the featured image of this post reveals about water and ozone, it is interesting that the WMO document does not appear to explicitly address correlations between the two. There are additional segments of interest and I’ll simply add more posts to address over time.
Recently, I acquired some data regarding both ozone and water vapor from aerial flights over the Boulder, Colorado footprint [2]. This information at least measures ozone and water vapor, often for the same times, locations, and elevations. There is quite a bit of information, and fortunately the source has integrated much of this into tables that are easy to process. Accordingly I’ve produced the next draft chart.
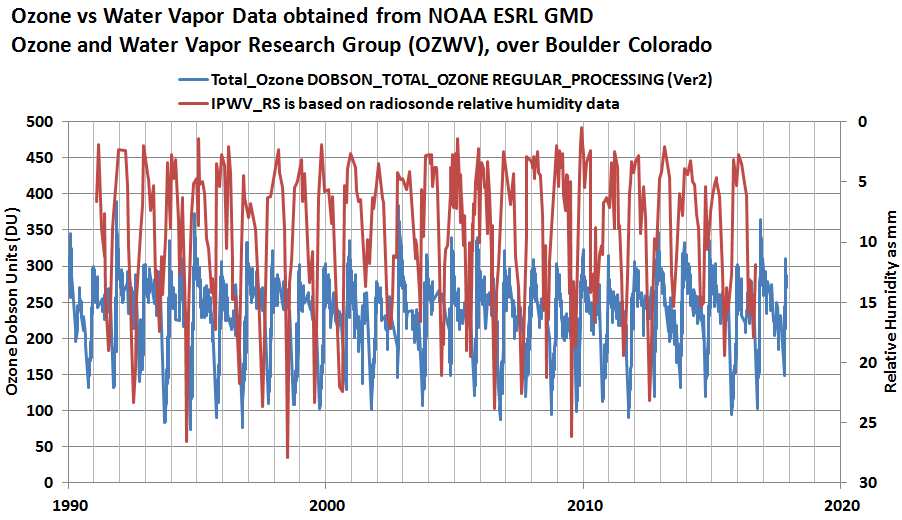
sources Ozone: ftp://aftp.cmdl.noaa.gov/data/ozwv/Dobson/dobson_toAMS.txt
and water vapor: ftp://aftp.cmdl.noaa.gov/data/ozwv/WaterVapor/IPWV/IPWV_BLD.txt
This again is from flights in which the two parameters are measured somewhat simultaneously. I find it compelling that as moisture (relative humidity) increases, ozone decreases.
I’ve gone an additional step to evaluate data provided by the same resource for two separate flights on two different dates, in which ozone and relative humidity were measured as a function of altitude over the same footprint. This allows for a comparison of vertical profiles of ozone versus atmospheric moisture. The two images follow in sequence.
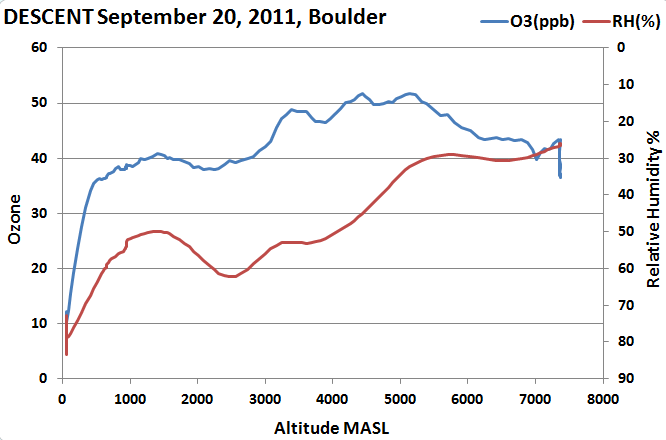
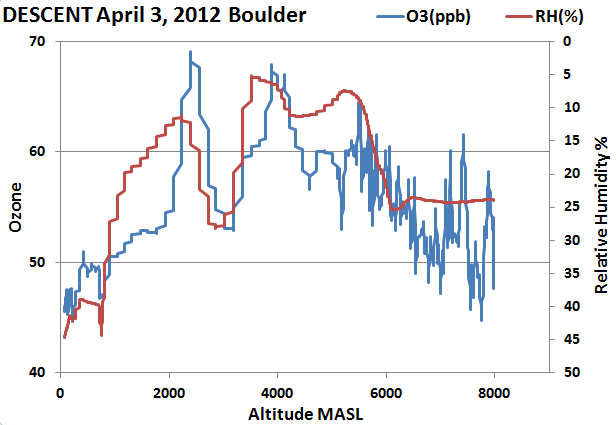
Sources for two images above: ACG_TOA5_04032012.o3.txt, ACG_TOA5_09202011.o3.txt, from ftp://aftp.cmdl.noaa.gov/data/ozwv/AircraftOzone/ACG/
Clearly again, moisture is inversely and highly correlated to ozone in the atmosphere. One might say that no matter how the atmosphere is profiled in time or space or both, the connection between atmospheric moisture and atmospheric ozone appears to be significant.
It’s also interesting that ozone in this northern hemisphere location consistently reaches its lowest levels in the boreal autumn (September and October). That’s the period of time when ozone scientists claim that the Antarctic ozone hole reaches its maximum. In other words the minimal ozone values over Boulder Colorado correspond well with the arrival of minimum ozone values over the South Pole.
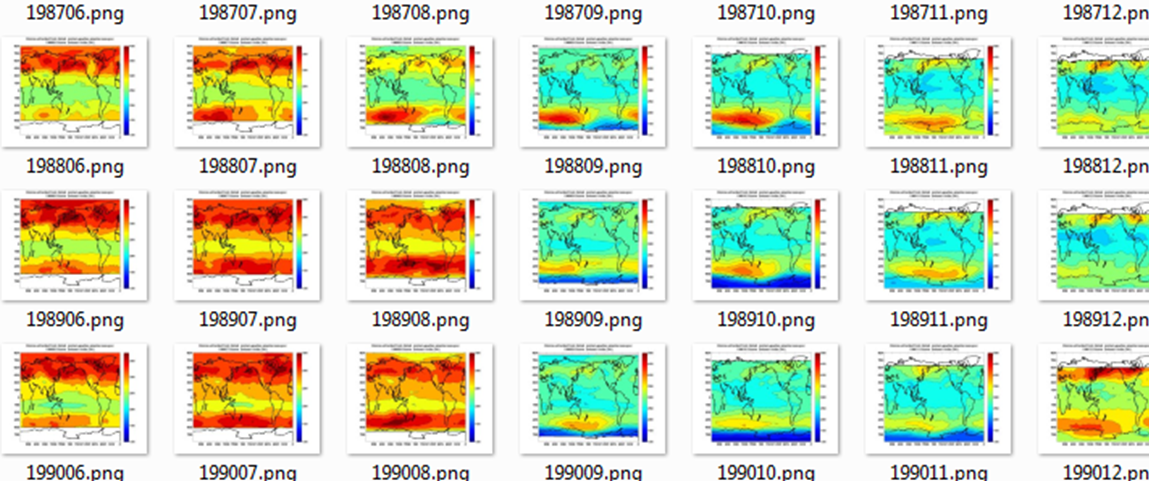
I have reached out with some of my concerns to a few who are known within the ozone community and continue to learn from many of them. For example, some have directed me to the Nimbus 7 sources [3] from which I developed the next image series excerpt below. This series provides additional and interesting patterns. I note that the boreal summer months always have the highest ozone concentrations (dark red contours) while the later fall and winter months express the lowest (blue contours). This holds throughout the planet and does not appear to be identified by any other sources if I’m not mistaken. Again, this also appears to align with the previous chart above concerning ozone patterns over Boulder, Colorado in North America.
This synchronous pattern is rather unique because typically the Antarctic experiences the opposite temperature patterns to the Arctic for any given solstice-anchored period (winter or summer at each respective hemisphere). Other than auroras, I cannot think of any other pattern that affects the two polar regions so clearly and so synchronously. If only because auroras and ozone patterns have that in common, I’m tempted to look some day into correlations of Coronal Mass Ejections (CMEs) to ozone patterns, as CMEs from our Sun are attributed to be the drivers of aurora displays.
To complement, I note from a previous post that the winter months appear to convincingly document strong areal correlations of atmospheric moisture with ozone. In any case, the rich possibilities motivate me to further examine the ozone data and its true causality. Current ozone literature attributes ozone patterns to CFCs and halons, and those are related by authors to Antarctic Spring upper atmospheric temperatures as a trigger. In a somewhat related context many ozone scientists appear to claim that most of the water vapor in the stratosphere comes from photo-oxidation of anthropogenic methane. This may be the subject of a future post here, as I try to reconcile that with other papers of stratospheric moisture circulation.
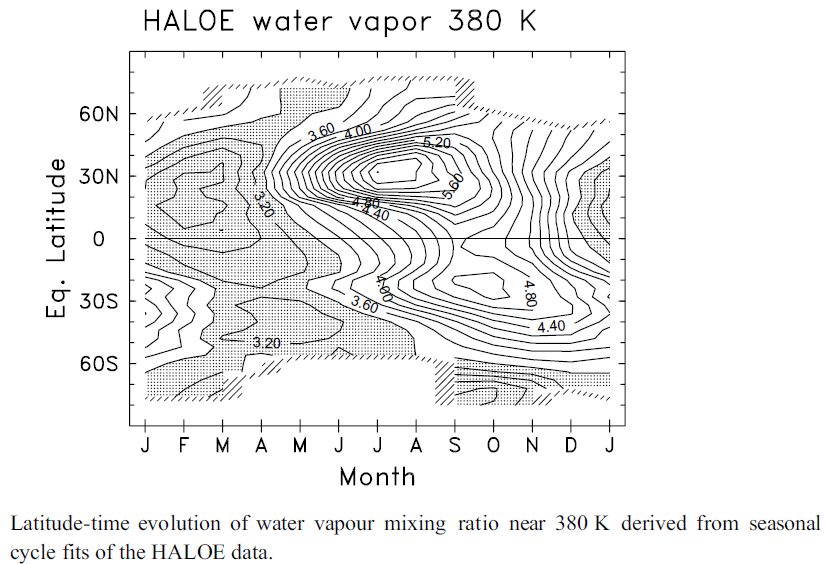
In my review of those assertions, I often find other items that tend to support the connections of moisture to ozone. For example, from Figure 3 of this resource by Kley et al., (1988) [4], reproduced below, one can see that the greatest upper level atmospheric moisture is found across the globe around the months of July through October. A more comprehensive coverage of this parameter in thickness and in time might add further insights.
Given the trends of this figure, along what I’ve related above, evidence by ozone scientists appears to confirm that the planet’s ozone distributions are:
- Primarily correlated to atmospheric moisture
- Reach global minimums in the boreal autumn (September and October time frames)
I would go so far now as to speculate on the seasonality of ozone formation and destruction. Rather than the case asserted by establishment ozone scientists that ozone-destroying man-made propellants and refrigerants incubate in noctilucent clouds until the arctic and antarctic spring thaws, whereupon they unleash ozone destruction, forming holes, I offer this very preliminary hypothesis: Every December the Earth reaches its closest distance to the Sun (perihelion), whereupon increases in the radiance of Solar UV trigger abundant ozone formation across our planet. This ozone is intermittently destroyed wherever it comes into contact with atmospheric moisture.
As noted, industrial production of refrigerants are the current focus as a cause of depletions of the world’s current ozone distribution. However the spectacular inverse correlations between our planet’s abundant atmospheric moisture and ozone patterns show potential as a sensible complement to greater understanding of this important phenomenon.
[1] World Meteorological Organization (WMO), Scientific Assessment of Ozone Depletion: 2014, World
Meteorological Organization, Global Ozone Research and Monitoring Project—Report No. 55, 416 pp., Geneva,
Switzerland, 2014.
[2] National Oceanic and Atmospheric Administration, United States Dept. of Commerce, Earth System Research Laboratory, Global Monitoring Division, Ozone and Water Vapor Research Group
[3] acdisc.gesdisc.eosdis.nasa.gov
[4] Kley, D., J.M. Russell III, and C. Phillips, Editors. SPARC Assessment of Upper Tropospheric and Stratospheric Water Vapour, December 2000, Prepared by the SPARC Water Vapour Working Group under the auspices of the
SPARC Scientific Streering Group. WCRP – 113 WMO/TD – No. 1043 SPARC Report No.2.
*I continue to reach out to NASA scientists regarding the data I use for this claim. Moreover, one can confirm to some extent by careful examination of the preceding figure.
This is a work in progress and includes opinions. Many Thanks as usual to the Las Cruces Atmospheric Forum for their valuable informal feedback and insights.