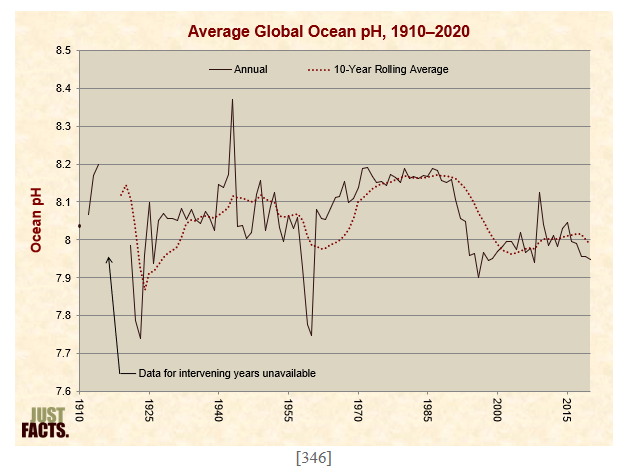
The JUSTFACTS site reached out to me a short time ago to confirm my work which challenges established ocean scientists regarding the so-called Ocean Acidification phenomenon. I have continued to explore this topic as well, and so we informally collaborated to update my earlier work at [1] to see if global ocean pH has gone up or down since then.
Here is a link to their ocean acidification discussion: Ocean acidification – Just Facts
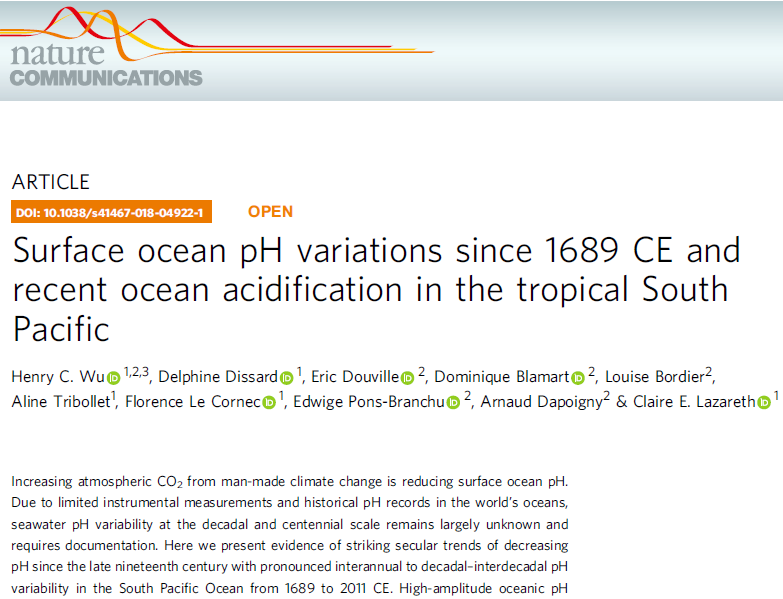
I appreciate their uncompromising approach to explore this topic. In my view, the century-long time series of measured ocean pH belongs front and center in any consideration of ocean health. The ongoing omission of this data is a topic which I hope scientists will work much harder to recognize and respond to. That would be preferable to products such as those by the authors of [2] which continue to promote the notion that oceans are acidifying. Although the Wu et al team [2] followed my lead [1] to relate ocean pH to the decadal Pacific temperature patterns, they implied that the instrumental data I spent a few years examining doesn’t exist. In their abstract they stated “Due to limited instrumental measurements and historical pH records in the world’s oceans, seawater pH variability at the decadal and centennial scale remains largely unknown and requires documentation.”
Years before the authors published [2], I explored correlations related to my paper [1] between decadal averages of the massive collection of omitted global ocean pH data (GOPpH) and numerous climate indexes. My quantitative exercise (featured in part within the chart below) included a Pacific Oscillation (similar to theirs), an ENSO oscillation (the same as theirs), the Atlantic Multidecadal Oscillation (AMO), a Rocky Mountain river flow record (Otowi gage in NM), Sunspot Numbers (SSN), and the very CO2 parameter of primary interest (MLCO2) to them. ML stands for Mauna Loa, the sole place where global carbon dioxide is indexed to.
The GOPpH significance testing chart below captures some of this work, and shows a strong correspondence of the actual data to the PDO. That makes excellent physical sense to me. In contrast, the inverted magenta cone indicates that there is no significant relation between atmospheric CO2 and instrumentally measured ocean pH. That poses a challenge to any claim of ocean acidification. On the other hand if the real data sets are not recognized, and unreal data are recognized, then the ocean acidification narrative can continue to grow, like a pHonzi scheme I guess.
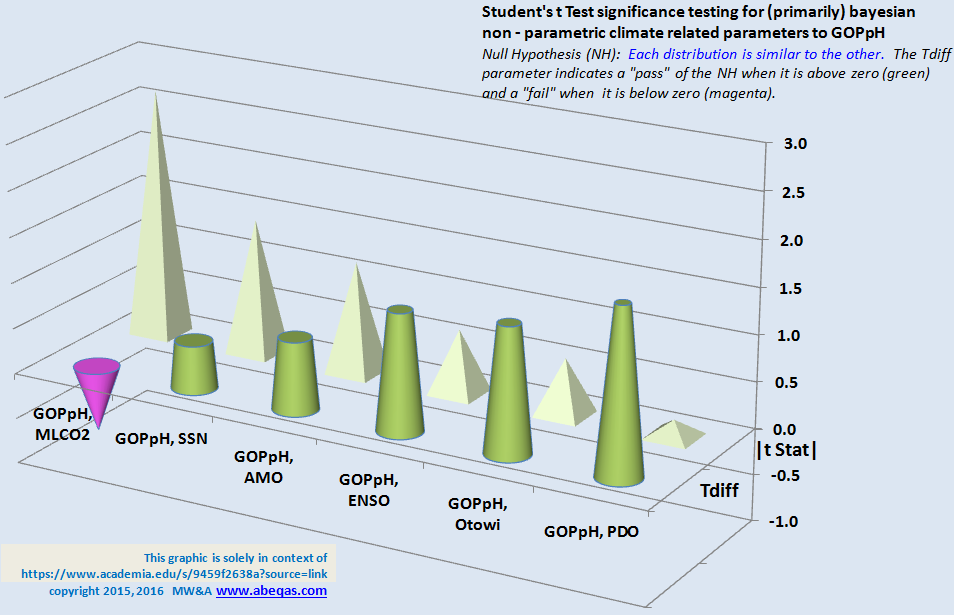
GOPpH Significance Testing Chart by Wallace
With regard to the recognition of unreal data, the authors of [2] do appear to imply that anthropogenic CO2 can actually be mapped across oceans. Yet I can infer from their own references that this is not the case. For example, their study focuses on seawater surrounding a small island, New Caledonia, in the South Pacific. Here is an excerpt from their Figure 1. Note for registration that the north island of New Zealand peaks above the lower border of the frame, and Australia is the large gray mass at the left border.
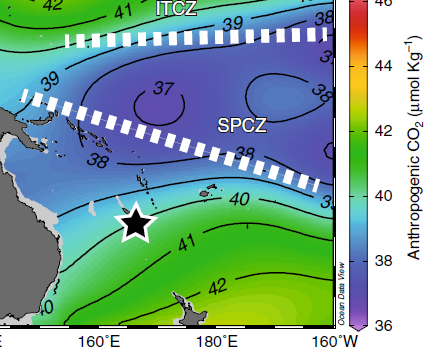
Excerpt of Figure 1 from Wu et al. [2]
It looks as if they cite a paper by Raupach et al. [3] to support this claim. Yet here is an excerpt from that reference which in fact, repudiates the claim of [2].
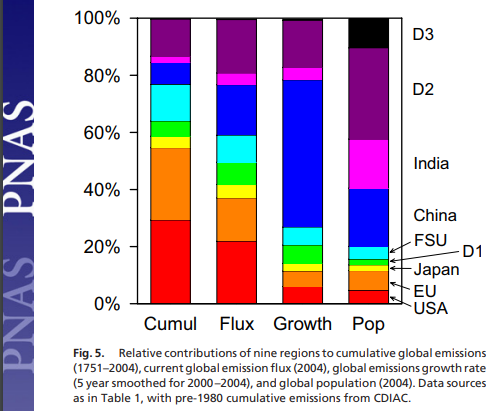
Excerpt from Figure 5 of Raupach et al., [3]
I could go on and on about this paper. But if time permitted, I could do so for hundreds if not thousands of actual peer-reviewed ocean acidification publications, each of which deny actual instrumental data and invoke irreproducible data such as this example I’ve extracted from [2]. For my part, I’ll continue to recognize both the instrumental pH data and its high accuracy.
I only have positive things to say about Researchers Will Reynolds and James Agresti at JUSTFACTS. They asked me original and tough questions and I welcomed this chance to demonstrate the transparency and reproducibility of my past ocean pH work. In actually conducting the scientific method by seeking to reproduce the work of another, JUSTFACTS breathed new life into this ocean pH concern. Time will tell if that leads to any improvement for the lay and science communities. For those who would like to join in seeking sunlight, perhaps consider signing this old but still worthy petition.
[1] Wallace, M.G., 2016, A data based time series for global ocean pelagic pH. white paper, serially submitted in this basic form to three ocean science journals. Serially rejected by all. As this is a blog I don’t mind relating that one journal claimed that the oceans were not buffered solutions in their rejection rationale. 😀
[2] Wu, H.C., Dissard, D., Douville, E., Blamart, D., Bordier, L., Tribollet, F.L., Pons-Branchu, E, Dapoigny, A. and Lazareth, C.E. 2018. Surface ocean pH variations since 1689 CE and recent ocean acidification in the tropical South Pacific. NATURE COMMUNICATIONS|(2018)9:2543| doi: 10.1038/S41467-018-04922-1
[3] Raupach, M.R., Marland, G., Ciais, P., Le Que´re´, C., Canadell, J.G., Klepper, G., and Field, C.B., 2007. Global and regional drivers of accelerating CO2 emissions. Proceedings of the National Academy of Sciences (PNAS) Vol. 104 no. 24 https://www.pnas.org/content/pnas/104/24/10288.full.pdf
[4] Wallace, M.G., 2019, Application of lagged correlations between solar cycles and hydrosphere components towards sub-decadal forecasts of streamflows in the Western US. Hydrological Sciences Journal, Oxford UK Volume 64 Issue 2. doi: 10.1080/02626667.2019.
* Any are encouraged to take a look and see for themselves. I’m going with these resources for now, which support my claim: NOAA states “Most fossil fuels, like oil and coal, which are ancient plant and animal material, have the same δ13C isotopic fingerprint as other plants.” at https://www.esrl.noaa.gov/gmd/ccgg/isotopes/c13tellsus.html and a recent article in NATURE Communications states “The effect of CO2 concentration on 13C/12C ratios is currently debated” https://www.nature.com/articles/s41467-017-02691-x