
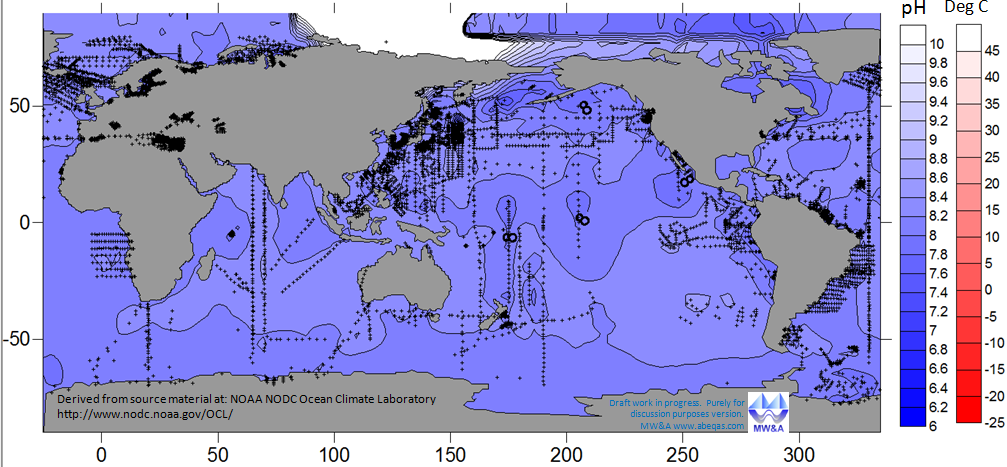
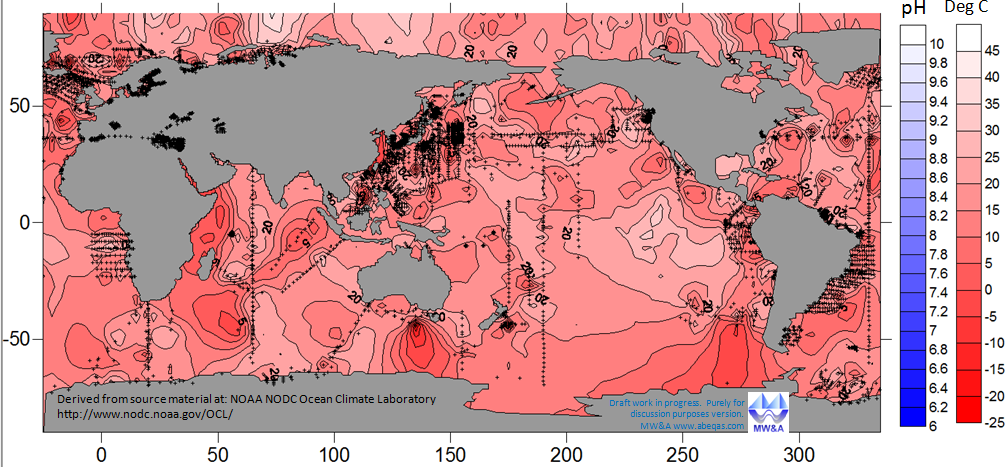
I’ve been recently sampling within the year of 1968 from NOAA’s WOD. A past sampling is featured at an earlier post In this example figure set, it can be seen that although they share a similar sampling location pattern over the selected calendar year, more measurements were published in the WOD for pelagic ocean pH (15,713 points after elimination of obvious outliers and redundant entries), than for dry bulb temperature at the surface (10,880 points). In producing these first two contours, I used the same limits and other settings, as well as the same kriging approach as in the earlier post.
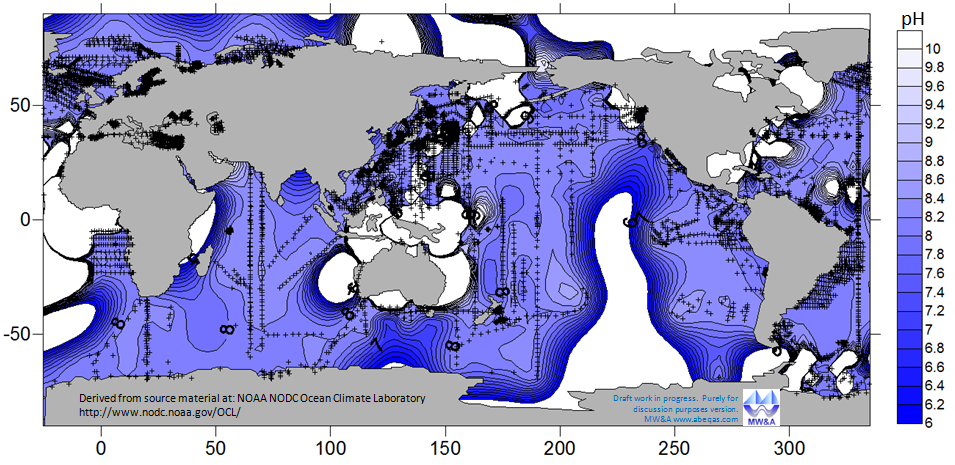
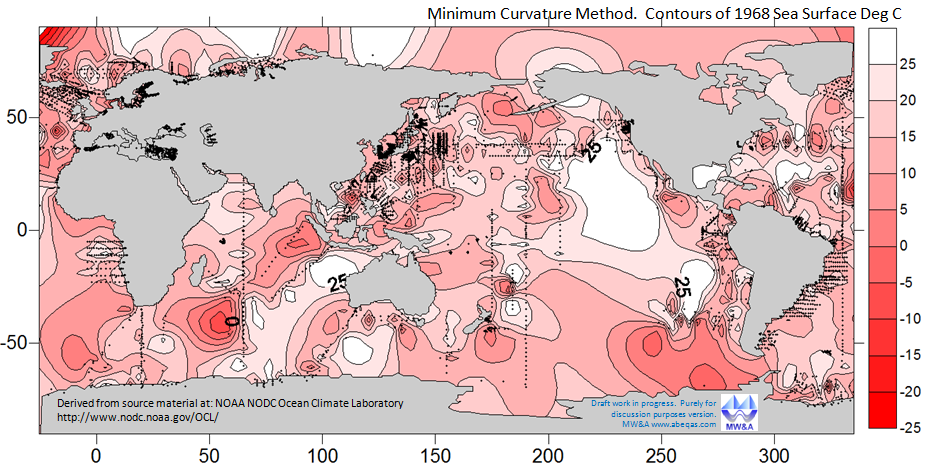
The following figures are additonal examples of gridding and contouring of the same 1968 pH and ocean surface temperature data sets. In this case, I utilized the default SURFER settings within the method of minimum curvature for gridding of the raw data. This method and the associated settings, including those regarding data value ranges, in these examples, succeed roughly at avoiding data-poor regions.
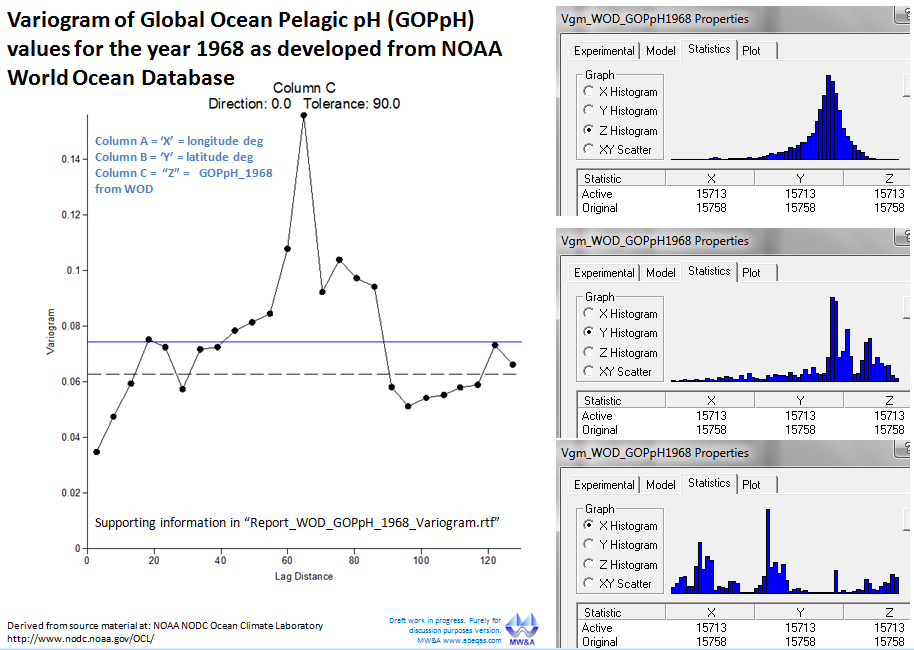
I continue to evaluate geostatistical parameters associated with each contour plot featured in this series of posts. One example includes excerpts from a variogram analysis for the 1968 GOPpH data set.
| Univariate Statistics for Z column (GOPpH1968) | |
| Minimum: | 6.56 |
| 25%-tile: | 8.04 |
| Median: | 8.18 |
| 75%-tile: | 8.27 |
| Maximum: | 8.91 |
| Midrange: | 7.73 |
| Range: | 2.35 |
| Interquartile Range: | 0.22 |
| Median Abs. Deviation: | 0.11 |
| Mean: | 8.12 |
| Trim Mean (10%): | 8.14 |
| Standard Deviation: | 0.25 |
| Variance: | 0.06 |
| Coef. of Variation: | 0.03 |
| Coef. of Skewness: | -1.68 |
It is encouraging to see that the reported mean value for 1968 of 8.12 aligns well with a previous plot. Yet, as always for these contour plots, please keep in mind the impacts of the boundaries, locations and depths of data, seasons of data collection, coordinate transformations, and numerous other factors, upon the contouring results. In addition, the continental sketches are only approximate. Accordingly, it is premature to reliably interpret any image shown here, other than gross characteristics perhaps.