NASA and other agencies promote a narrative that the polar ice cap is shrinking exclusively due to anthropogenic warming [1].
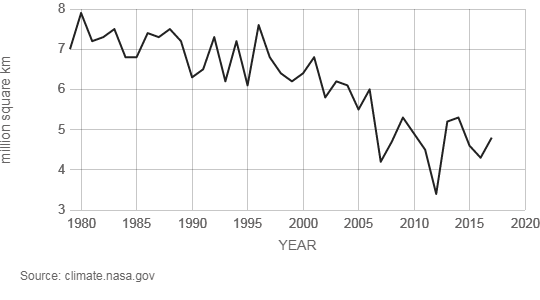
My work suggests an alternate and more natural cause. The reason for arctic ice fluctuations may be primarily due to ordinary geostrophic wind patterns.
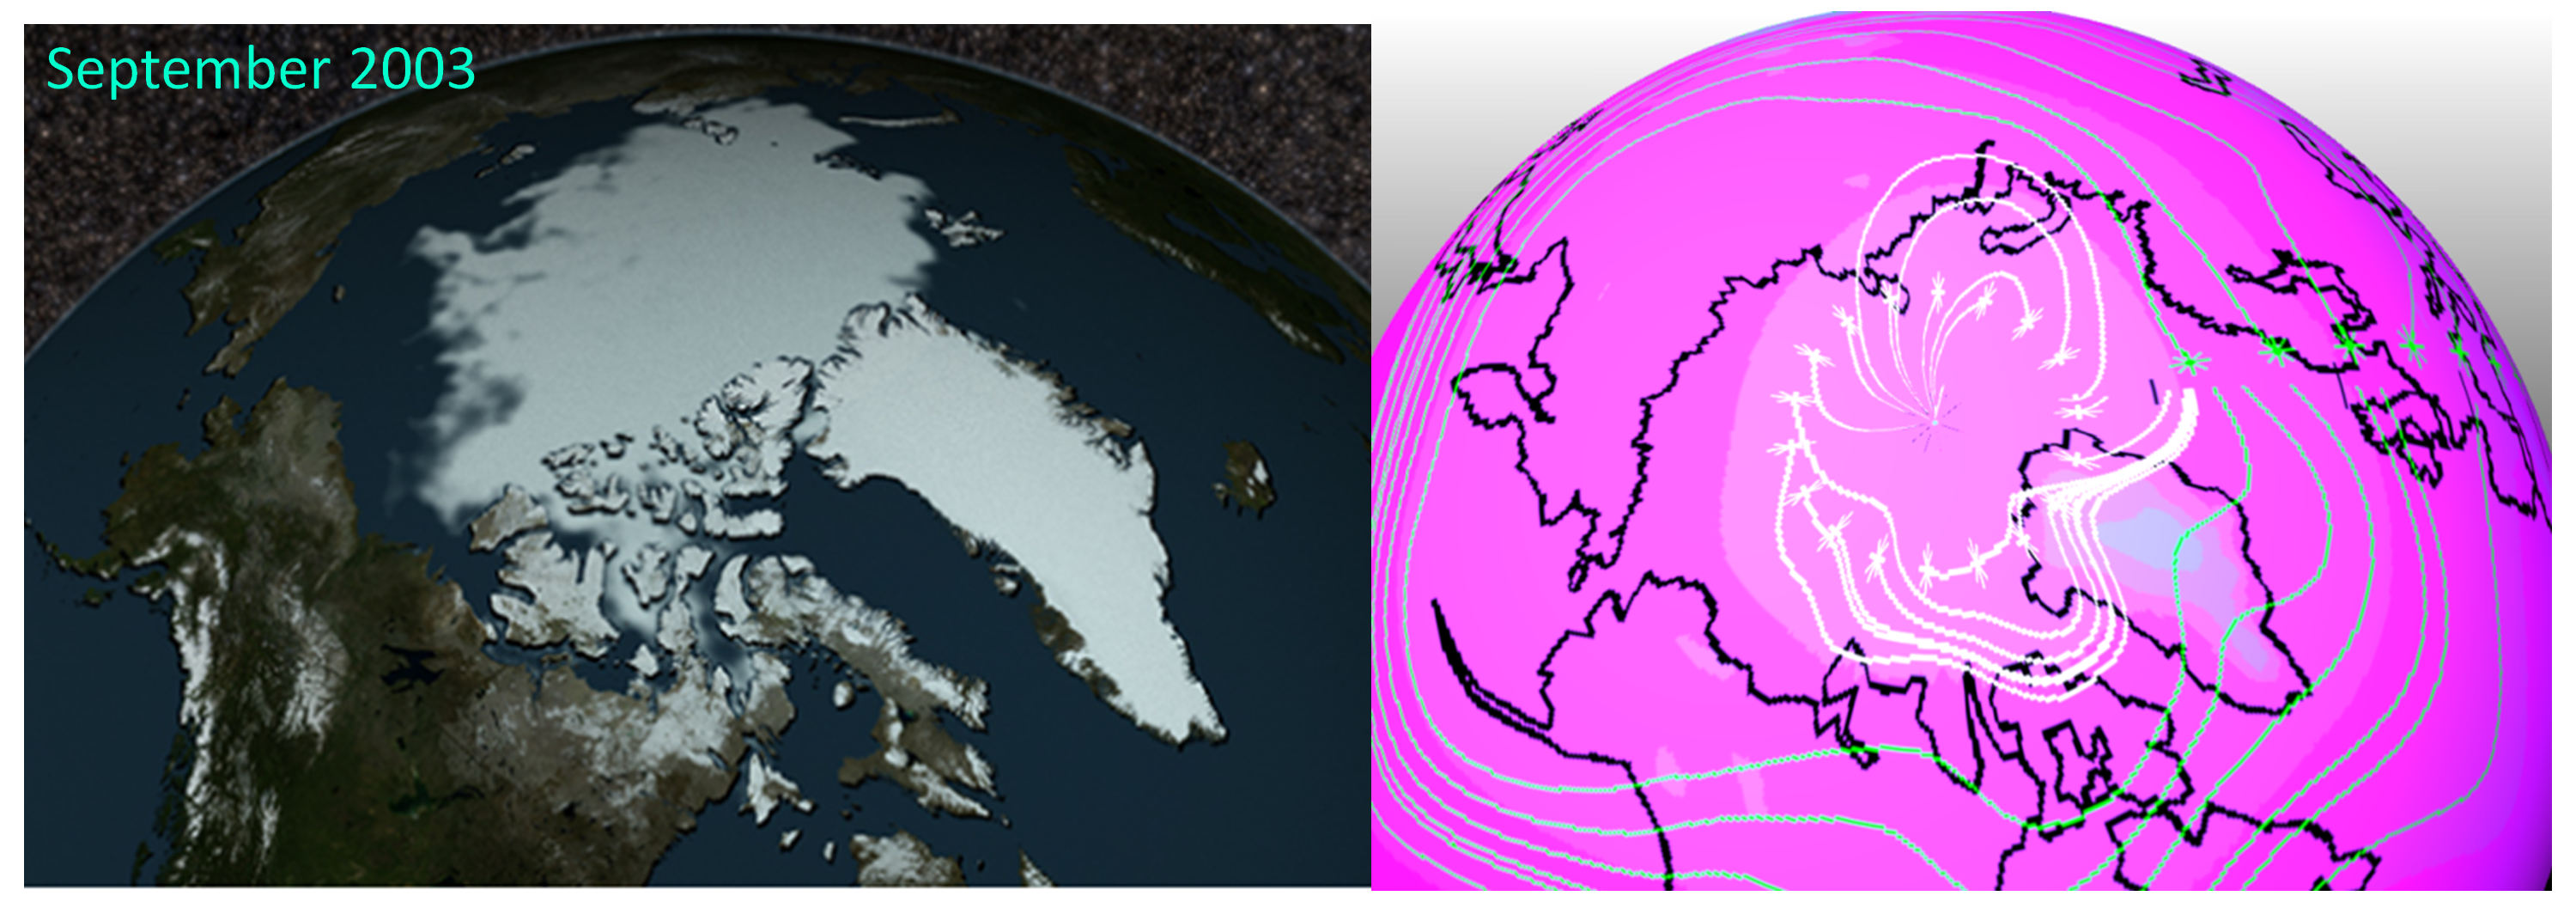
To explore my geostrophic wind causality notion, I’ve taken screen shots for the years 1979, 2003 and 2005 at that NASA site and compared to the UCAR- ERAI (satellite reanalysis products) full atmospheric thickness geostrophic wind coverages in the featured animation and in the following three image pairs below.

Geostrophic Wind Patterns May Explain Much Of The September Polar Ice Fluctuations
Note that the right column of images represent the geostrophic streamlines and geopotential height contours for the same month and year as the NASA images along the left column. The stars in those right hand plots represent the origins of the streamlines shown. The color contours use a MATLAB “cool” scheme in which the deeper blue the color, the lower the geopotential height (Z, kg/m) of the full atmosphere. As I note in other posts, Z is often highly correlated to temperature, T. I believe that can be safely assumed for these cases as well, so that the blue zones over Greenland represent the coldest zones and the deep magenta zones represent the warmest.
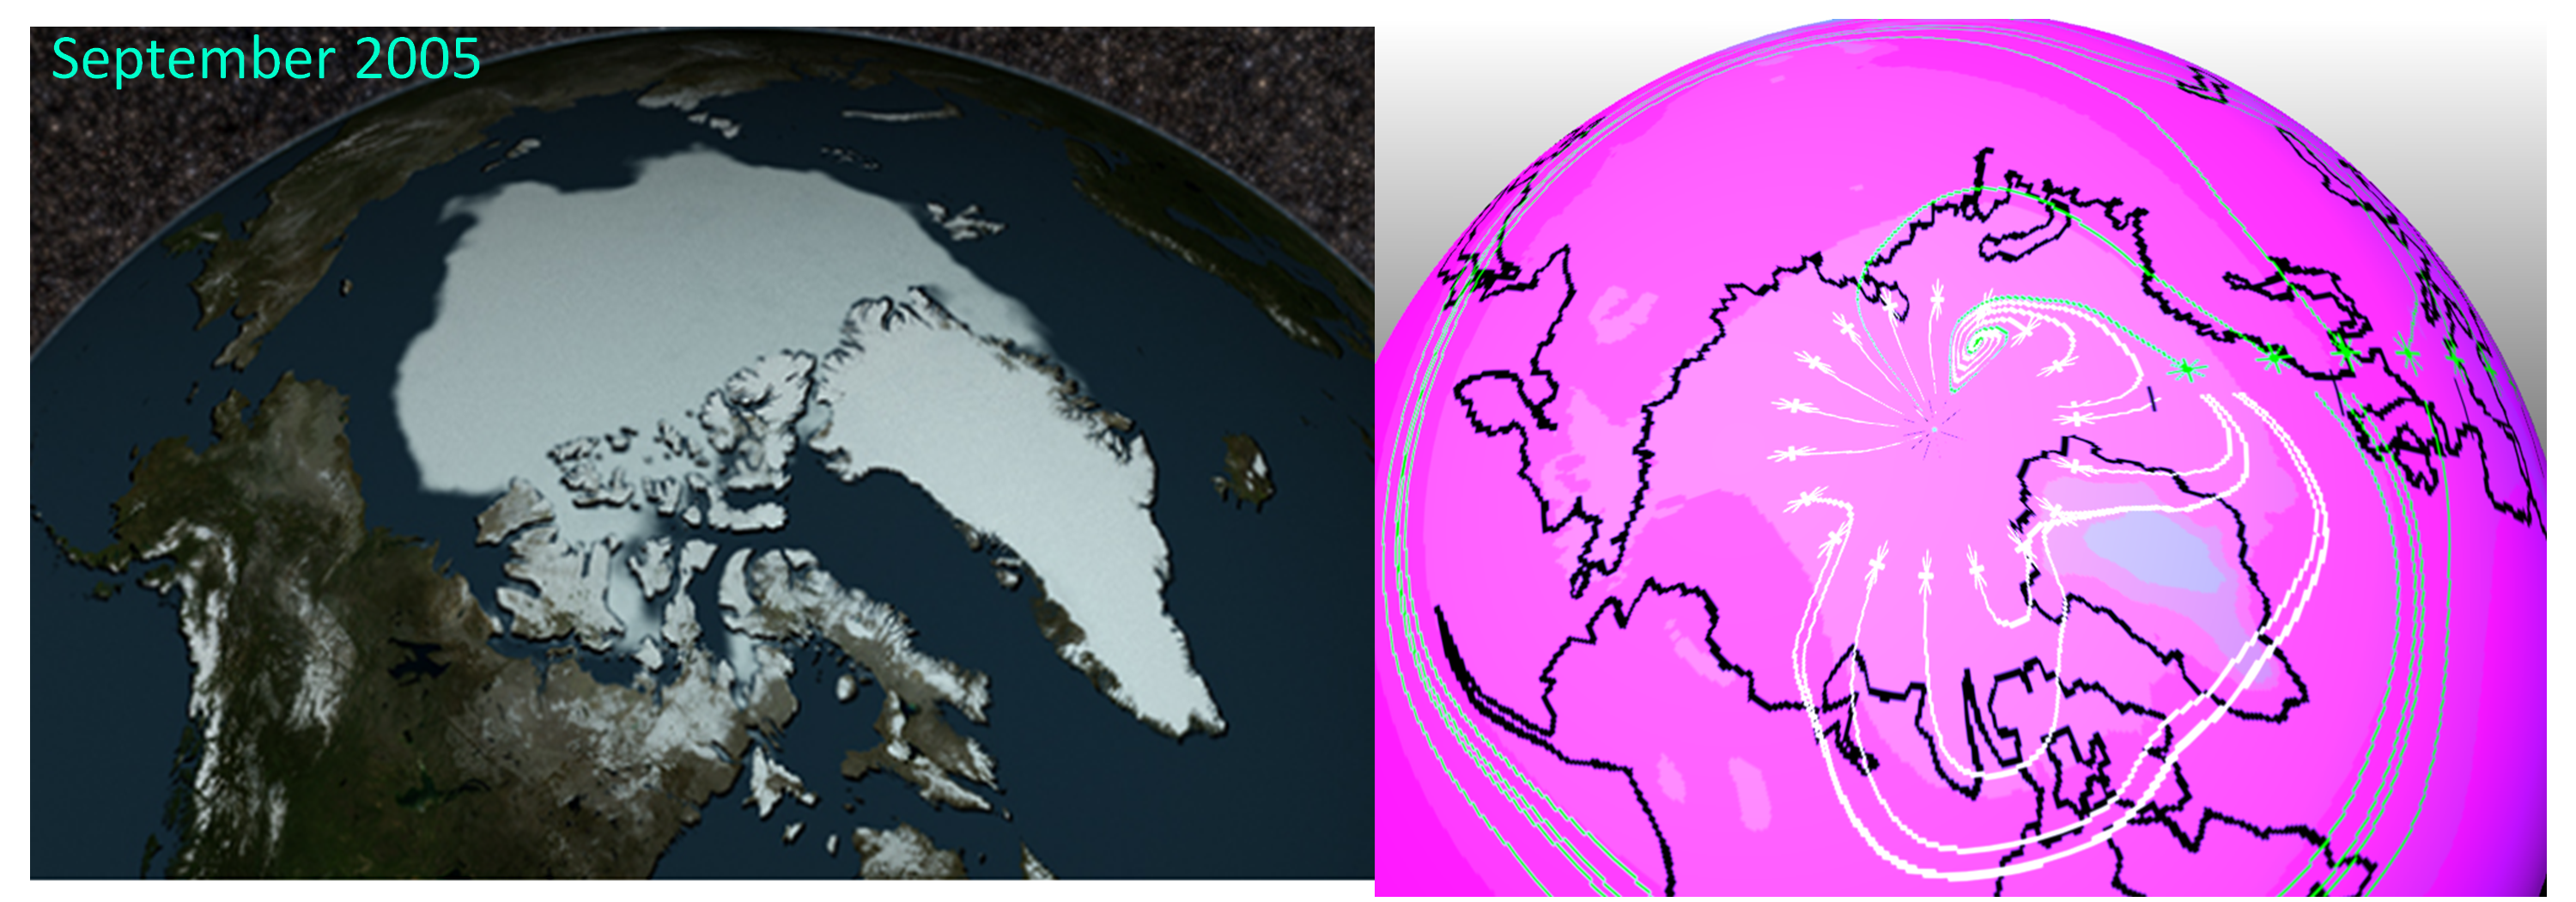
The circulation patterns suggest that when winds flow northward from warmer continental regions towards the poles over the month of September, the ice cap margins in their path accordingly melt. Conversely, when polar region winds form eddies or advance towards continents, the ice cap margins are preserved or expand.
For example, in the 1979 set, winds from the polar regions flow towards northeastern Russia and the ice cap accordingly extends towards that boundary. Yet in 2003, the polar winds flow towards northwestern Russia and that is where the ice advances instead. Meanwhile for this same year, warmer winds from northeastern Russia (Siberia) flow northward and the ice margins near that border have retreated. Finally for September of 2005, polar originated flows in any southward direction are subdued, while warmer winds flowing northward from Siberia are augmented. That appears to largely explain why the ice cap is significantly smaller in area.
POSTSCRIPT. I am sharing this final image which can be found at the site:
https://en.wikipedia.org/wiki/Arctic_ice_pack
U.S. Navy – Ice Atlas of the Northern Hemisphere, 1946, David Rumsey Map Collection, Original ~ 50 Mb file reduced 20% quality.
I think it may be of interest given that it is for the month of March in the year 1946, which is not a minimal ice pack month. Yet the boundaries of the ice appear to closely follow the boundaries of minimal ice shown previously for the year 2005 in the NASA image. Satellite coverage was of course not available then but it is reasonable to assume that other coverages via land, aerial and ocean vessel based observations were adequate to develop this map.
I can’t explore geostrophic winds for the full atmosphere for that pre-satellite time frame, but the similarity of the March 1946 and the September 2005 profiles appear to also support the featured notion of this post.
[1] https://climate.nasa.gov/vital-signs/arctic-sea-ice/