Why is an inexpensive potentiometric glass electrode instrument so accurate in the measurement of pH, and why are derived pH values and spectrophotometric instruments* so costly and opaque?
I think it is best to start at this PMEL site which mentions my contributions. I will use their arguments and earlier discussions I engaged with those authors in as a template.
That site begins with the statement:
In order to measure changes that are due to ocean acidification we need to monitor very small pH changes in the global oceans. For example, anthropogenic carbon dioxide (CO2) has caused a pH decrease of approximately 0.1, which is about a 26% increase in the hydrogen ion concentration over the past 100 years. Monitoring these small changes requires very sensitive and reliable observations.
I naturally take issue with every sentence, particularly the first one (which will engage an entire subsequent post). But skipping for now the middle and jumping to the end, in which the authors assert the need for “very sensitive and reliable observations”, in my view these authors are referring to two separate lines of pH analyses, both of which have eclipsed normal best industry practices. Those lines are:
1. Calculation of pH based upon other variables, and
2. Indirect estimation of pH via the use of spectrophotometers as colorimeters for elaborate titration excercises
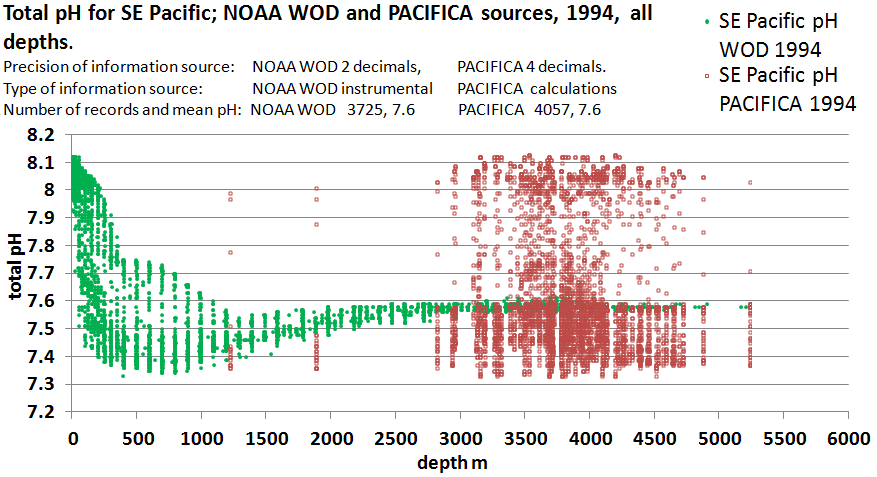
The Featured Image of this post offers some interesting comparisons between the method of 1. (red circles) and the standard best industry practice (BIP) of the glass electrode pH meter (green circles). The method that the PMEL authors favor in this comparison is based on indirect calculation as described in this statement, “pH on the total hydrogen concentration scale at 25ºC was derived from adjusted TCARBN and ALKALI. ” [1]
How can two sets of observations be so different? Why yet do the red circles seem to be anchored in the green? Why are the red values limited to such great depths and what is the implication of using such deep measurements when asserting global ocean acidification? I will break this down further but to start one need only note that the green dots are the supporting information for the east Pacific region of 1994 which I have used in my earlier post. That post compares ocean pH on both sides of South America and arrives at interesting conclusions that not only challenge the mainstream narrative of ocean acidification, but also the narrative of the so-called Atlantic Meridional Overturning Circulation (AMOC). Moreover, the post adds to the growing body of evidence that warmer waters are consistently associated with higher pH.
Finally and most curiously in this context, that prior post shows an excellent correspondence between the glass electrode pH measurements of ocean pH, and earlier developments of ocean pH by derivation from other measured carbonate chemistry parameters. In other words, the same type of calculation exercise promoted by the PMEL authors for the PACFICA dataset featured here, cannot even be reconciled with an earlier study which covered the same topic. Accordingly, the PACIFICA data, which claims an astounding resolution of 4 decimal points, cannot be reconciled with any other dataset, whether from similar calcuations, or from the reliable glass electrode pH meter.
Accordingly, the green BIP values are consistent with what is already understood regarding ocean temperatures and circulations, whereas the red Method 1 values are not.
Stay tuned for the further elaboration of the strength of the potentiometric approach and the clear deficiencies of the other two methods.
*These non-potentiometric methods are exclusively promoted in sources such as the Wendy Schmidt Ocean Health X Prize and the Pacific Marine Environmental Laboratory (PMEL)
[1] http://cdiac.ornl.gov/oceans/PACIFICA/ndp092.html