The tiny and mountainous island chain of Hawaii is pounded by distinctive states and scales of ocean waves from every cardinal direction and from season to season. As noted in a now dormant NASA web page which quotes “Dr. Shang-Ping Xie, professor and researcher at the University of Hawaii’s International Pacific Research Center and Department of Meteorology (who spoke:) .. If you look at a large region of the Pacific Ocean, you can barely see the Hawaiian Islands. But if you look at the winds or currents in that region, you can clearly see the influence of the Hawaiian Islands. It’s very pronounced.”
Moreover a very handy wave guide for surfers is of interest at
http://www.kauaiexplorer.com/guides/beach/seasonal_surf_trends.php
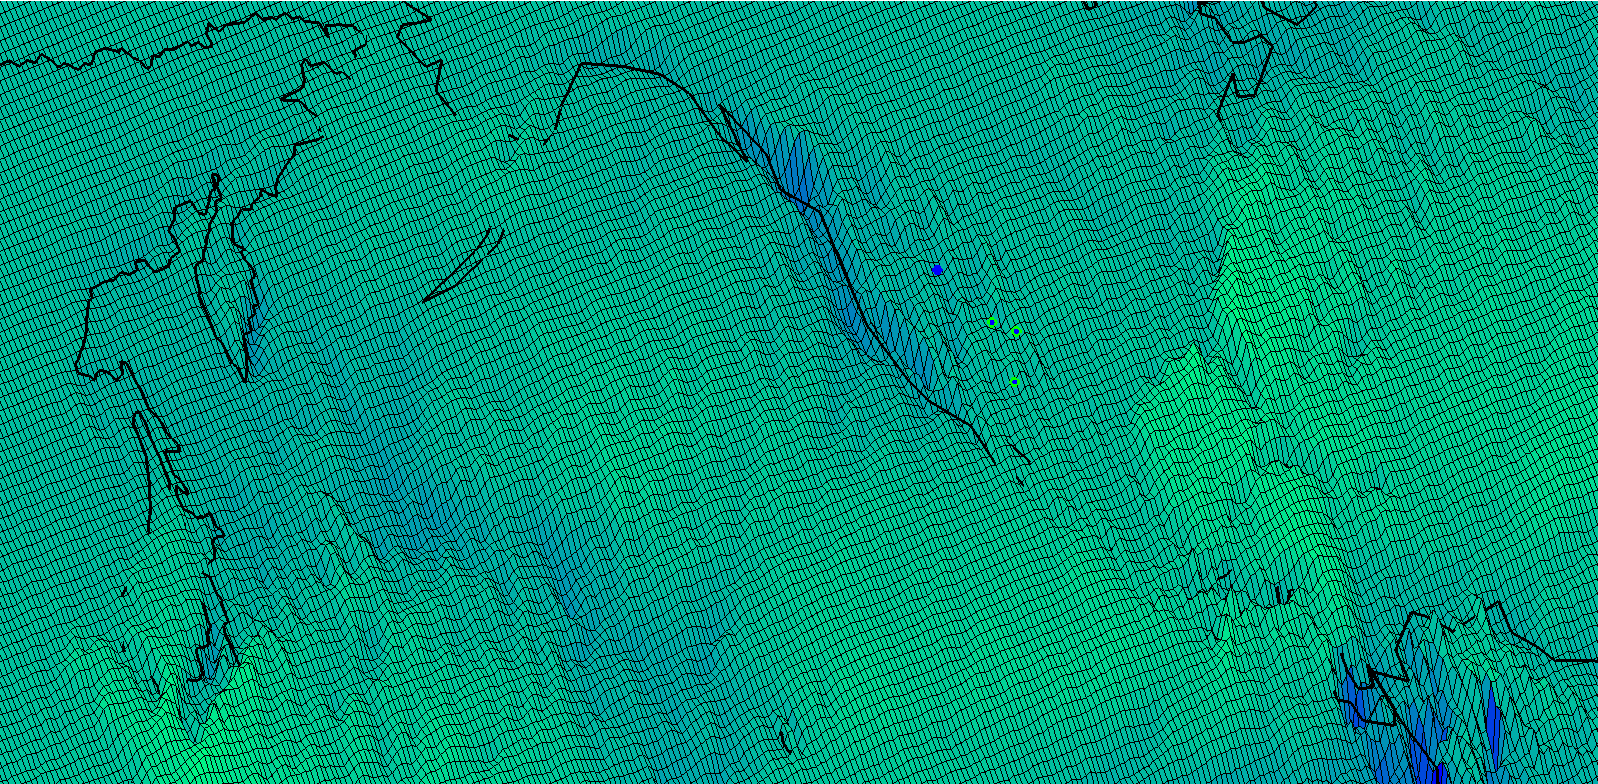
The greatest waves strafe the northern shores, traveling from the west. That is what I happen to see in the featured image in which the ridges and valleys of the atmospheric moisture surface are aligned largely north to south, and which as explored in greater detail at one of my original posts on geostrophic atmospheric moisture waves, are for this particular winter month are all transporting from west to east, in accordance with the prevailing westerlies.
In the featured surface plot the color changes and elevations both represent the same thing, a measure of atmospheric moisture. The deeper and bluer the surface, the greater the relative amount of atmospheric moisture. Some might find this as refreshing as I do, but the higher and frothier parts directly reflect evaporation, and the deeper more chilled parts reflect precipitation. This plot is developed from a winter month of a certain year.
There are other equally important variables in the atmospheric puzzle, but none that I’ve examined have quite this level of surface “exuberance”. I plan a new post soon regarding my concern that surface hydrologic and geostrophic variables should be the starting bases for the, after all synoptic, evaluations of any regional climate question. I plan to add links including to my post on stable isotopes because the circulation coverages are complementary although over a different time scale setting..
One can also see Hawaii’s cute dimple in the full atmosphere quasigeostrophic continuum, as a tiny black line at the proper location in the above featured image (center bottom). I can find many notable examples in my “stochatlas” as well as in previous posts. These somewhat corroborate the work of Dr. Xie. Clearly Hawaii can leave its outsized trace in the full atmosphere. On the other hand, by limiting my analyses to the full atmosphere for one particular winter month, the circulation patterns do not resemble those of Dr. Xie.
I also didn’t find an attempt in Dr. Xie’s paper to align what surfers know about the massive waves which can dominate across the western and northern slopes of Hawaii with his vector map of prevailing wind directions coming from the east. In any case the full atmosphere above and around Hawaii, based on UCAR satellite reanalyses fits my past general circulation descriptions. In that post the main island of Hawaii is shown only. I’ll continue to expand upon this initial description in later posts. In the later post I promised, I’ll include some interesting plots relating to shears and vortices in the synoptic atmosphere including the Planetary Boundary Layer.
I’m encouraged to see in this preliminary examination, that everything about Hawaii’s surf patterns appears to corroborate my informal notions about atmospheric moisture waves. As the scales of both are explored in more depth, along with the most interesting underlying ocean currents, as many know, a richer understanding of our hydroclimate will hopefully develop, perhaps with impressive applications.
Finally I’ve obtained a copy of Xie, S.-P., W.T. Liu, Q. Liu, and M. Nonaka. 2001. Far-reaching effects of the Hawaiian Islands on the Pacific Ocean-Atmosphere System. Science. 292(5524):2057-2060. It’s interesting and I will shortly post again to track some comparisons their Planetary Boundary Layer (PBL) information to similar PBL vectors that I’ve already developed.
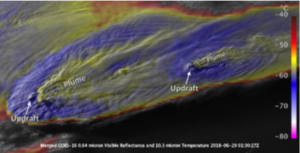
As I gear up to explore more atmospheric moisture wave imagery around and about the trade winds regions, I think these NASA images, looking down upon the upper surface of anvil-heads from thunderstorms, over North Dakota are a welcome distraction.