It might seem over the top, but worth considering if ever global moisture were so closely tied to solar signatures as through these adaptations I developed including background from a figure by Dr. Roy Spencer.
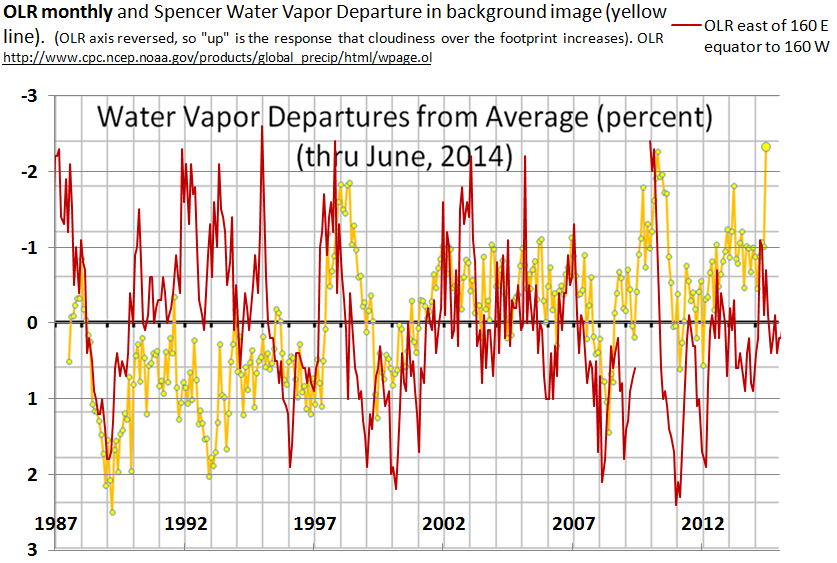
I start with featured image which is an overlay onto Dr. Spencer’s global satellite water vapor chart with my own reproductions of the time series of the OLR signature. I explore the OLR Solar connection in a paper I’ve submitted for peer review. I also touch on this at my previous QuasiGeostrophic post. This OLR signature is accepted to also approximately represent the degree and extent of high clouds above the earth’s tropical west Pacific tropopause.
Accordingly the OLR is expected to match other signatures of moisture in that region. I confirmed such a match by examining the ERA Interim LEDIV (Latent Energy Divergence) for a patch which the OLR signature overlapped within the equatorial west Pacific region. The LEDIV signal is expected to vary according to the degree of cloud formation in any case and it does, as the next figure illustrates.
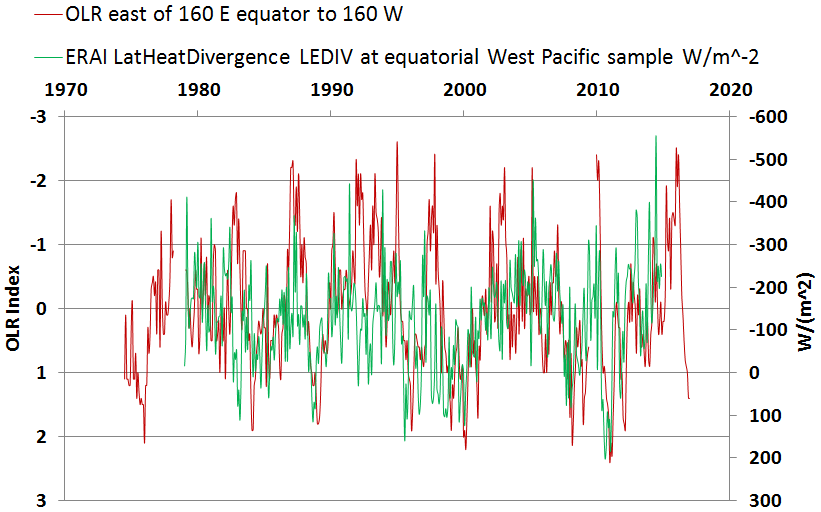
In other words, the OLR signature can serve as a proxy for one aspect of atmospheric moisture circulation through the so called ITCZ (Inter Tropical Convergence Zone).
As previous posts indicate, the OLR itself is correlated at least on some scales and lags to the SSN signature. This second image shows the monthly SSN overlay to the monthly OLR, with the Spencer coverage removed for clarity.
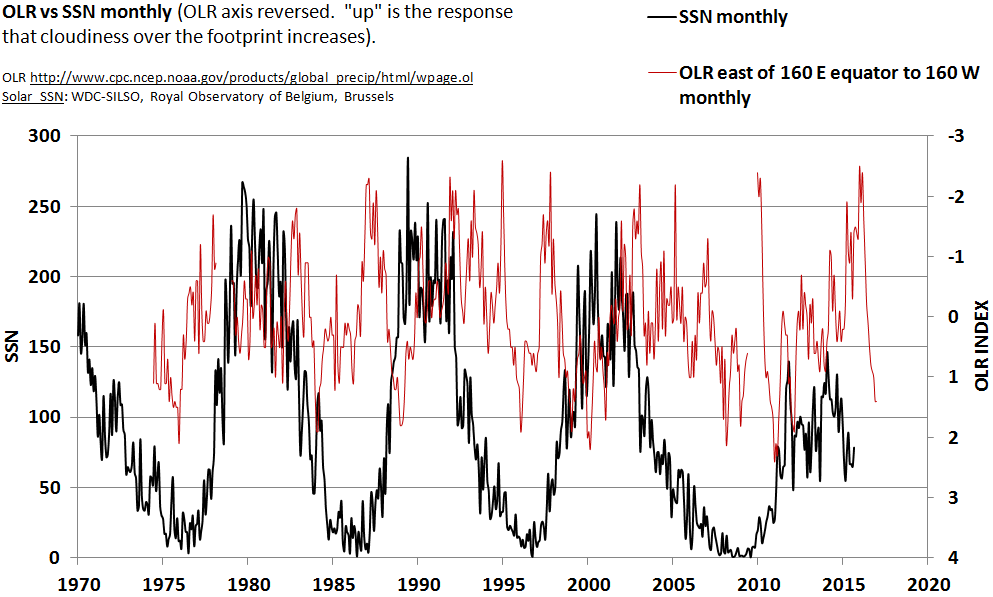
mwaSSNvsOLR
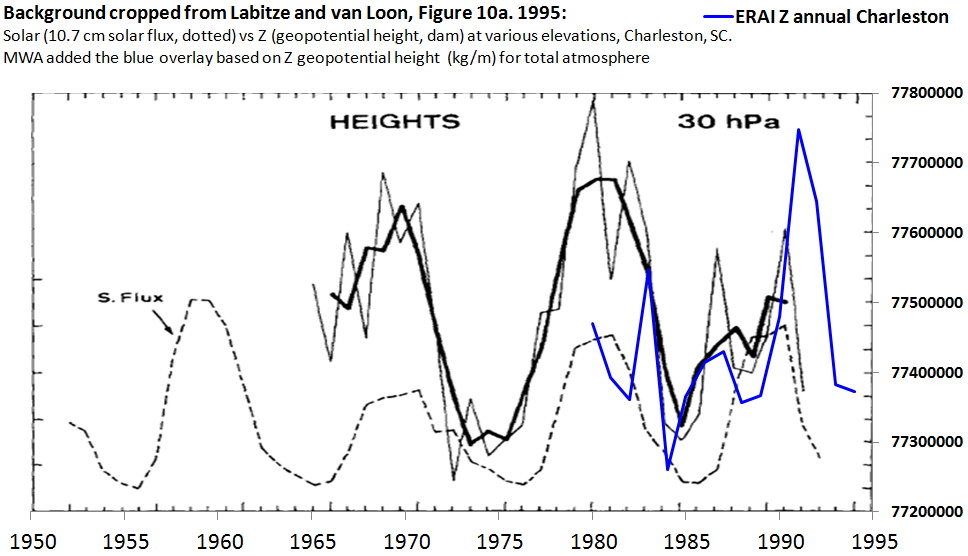
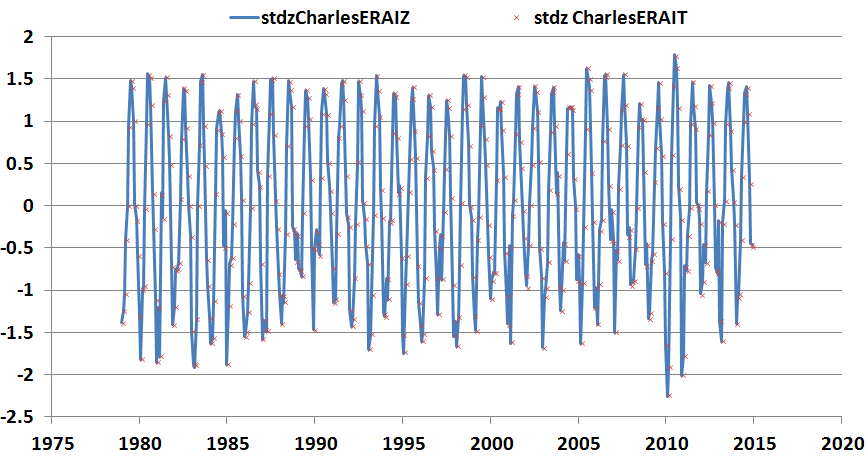
It adds to the establishment of supporting data by examining yet another QG thread, the geopotential height and temperature in comparison to each other at Charleston, SC and in comparison to the SSN index over time. This is a good location for such a comparison because of the the previous examinations of geopotential height, temperature, and solar effects above Charleston in the past by Labitzke and van Loon, 1995 [1].
It looks as if the independent thread of data lends support to their earlier work in both the alignments to geopotential height (accounting for their narrower domain) and to solar signatures. Predictability of Z years in advance for a broad spectrum of locations appears assured as suggested by this figure below.
mwaCharlotteTemperature
Should the correlations continue to be verified, then prediction of that might improve predictions over such time frames of moisture and temperature, as suggested by the next figure. That figure shows the close alignment between geopotential height of the full atmosphere and temperature of the full atmosphere over the Charleston, SC footprint even at a monthly resolution.
At this point I have introduced the reader to correlations between solar cycles, geopotential heights, and temperatures as well as correlations between those cycles and the OLR index, which is a component of ENSO and the LEDIV for a western equatorial Pacific footprint.
There is emerging evidence of additional correlations of solar cycles to premier climate index components. For example, the Southern Oscillation Index (SOI) is also an important component of ENSO [2]. The following image attests to its strong similarity to the OLR as well as to solar cycles. Since first posting this, I have read at least one blog at WUWT regarding additional apparent connections between solar signatures (the Ap series which is similar to SSN) and the SOI. One wonders what the benefit to ENSO is of two regression parameters which are so similar to each other. That discussion can be deferred to another post.
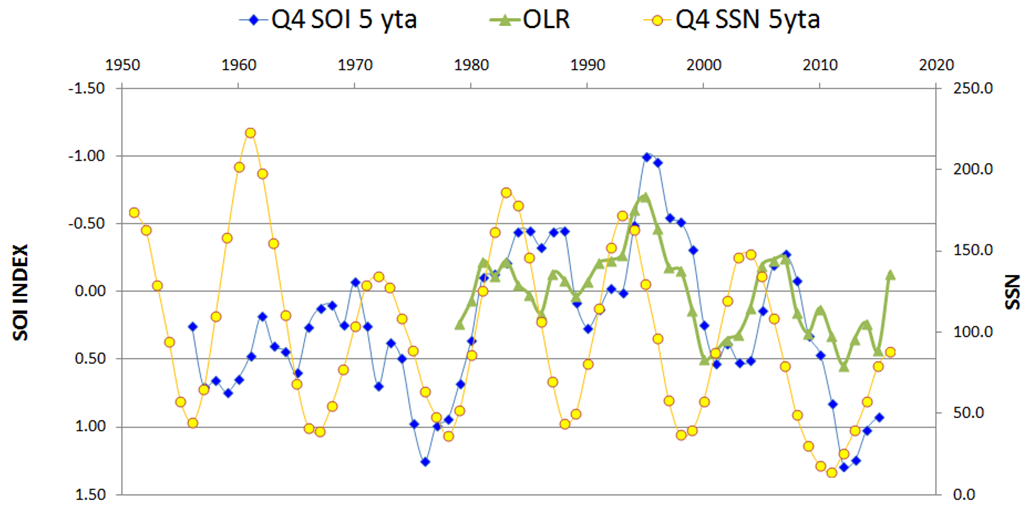
mwaPlotsSolarSOIOLR
Past posts have also explored similarities of Indian Ocean cyclone components to solar cycles as well as the similarities of solar cycle periodic factors via Fourier analyses, to periodic factors for many streams of the Southwest US. Other work is also presented and cited on even more connections.
In informally developing a summary list of climate factors associated with sunspot numbers, the range of connections that are not likely to be controversial already appears impressive. The limited number of factors which appear to show promise as touched on at this site include cyclones, streamflows, temperatures, zonal pressure differentials (SOI), geopotential heights, atmospheric moisture, geostrophic winds, and equatorial convection (OLR, divergence of latent energy, and other indexes). There are numerous other suggested connections by many others, and some of those may also be profiled as time permits at this site.
Readers are invited to revisit this same page over time for updates or revisions.
[1] Labitzke, K. and Van Loon, H. 1995. Connection between the troposphere and stratosphere on a decadal scale. Tellus A, 47 A, 275-286.
[2] https://www.ncdc.noaa.gov/teleconnections/enso/indicators/soi/