This site contains over 35 posts about the mapping and distribution of ocean pH based on data from the NOAA World Ocean Database (WOD). I’ve often explored the ocean pH profiles for the year 1994 on both sides of South America. The 1994 data sets have been evaluated here for example. They can be quickly reviewed to identify the sampling locations as well as other aspects of this topic.
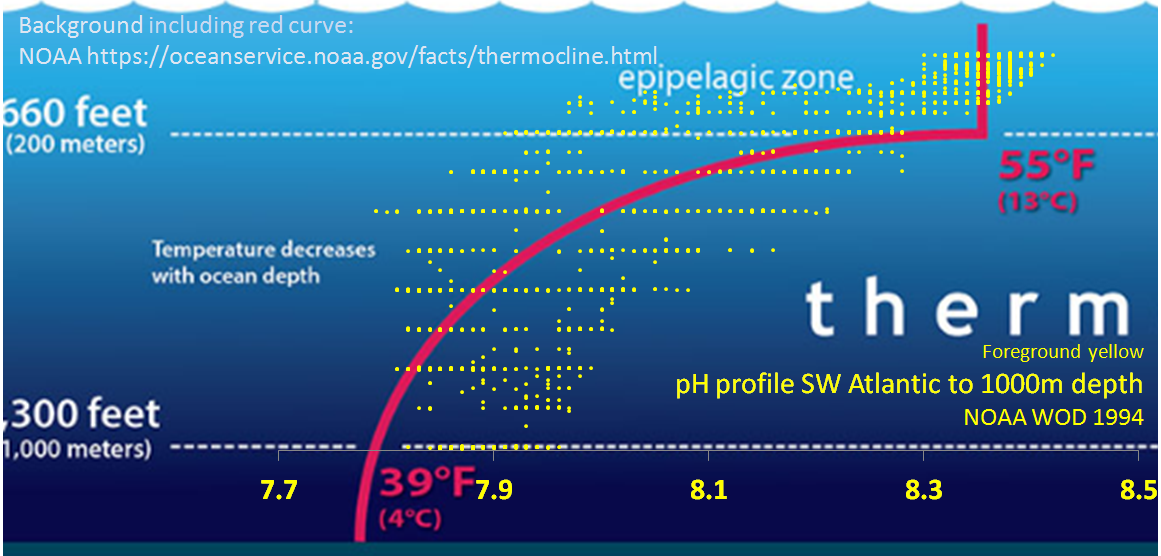
In the featured image above, I’ve simply adapted the 1994 pH vs depth chart for the southwest part of the Atlantic Ocean to overlay as yellow dots upon another chart by NOAA of the well known thermocline as the solid red line for the oceans in general.
It should come as no surprise to any earth scientist that the overlays are consistent. This is another reason that I embrace the 2 million ocean pH glass electrode meter readings covering 80 years of data from the 20th century.
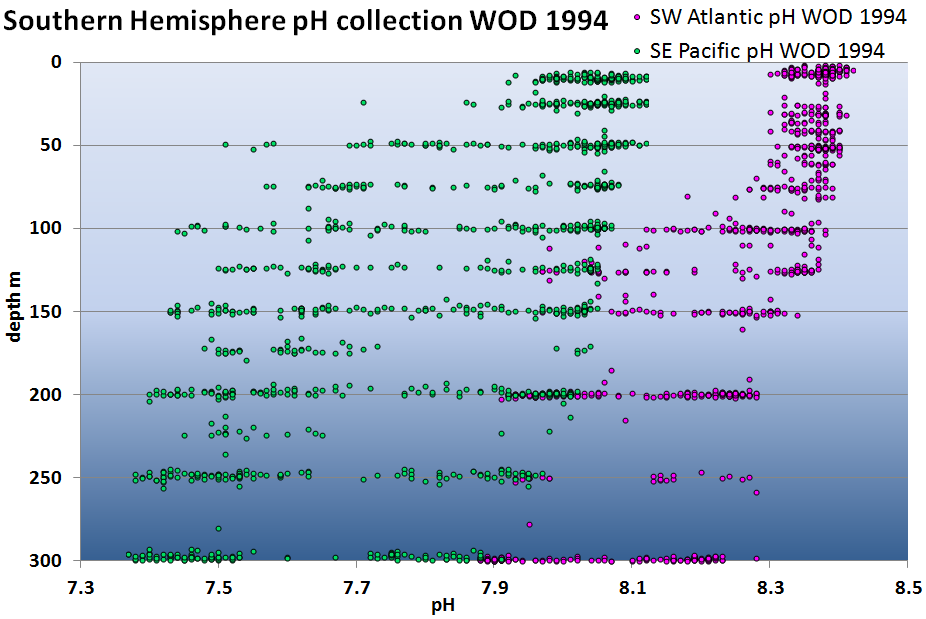
The next image consolidates some of these mid latitude southern hemisphere ocean pH records on both sides of South American for 1994. The thermoclinic profiles remains evident and some apparent limits begin to emerge for each region.
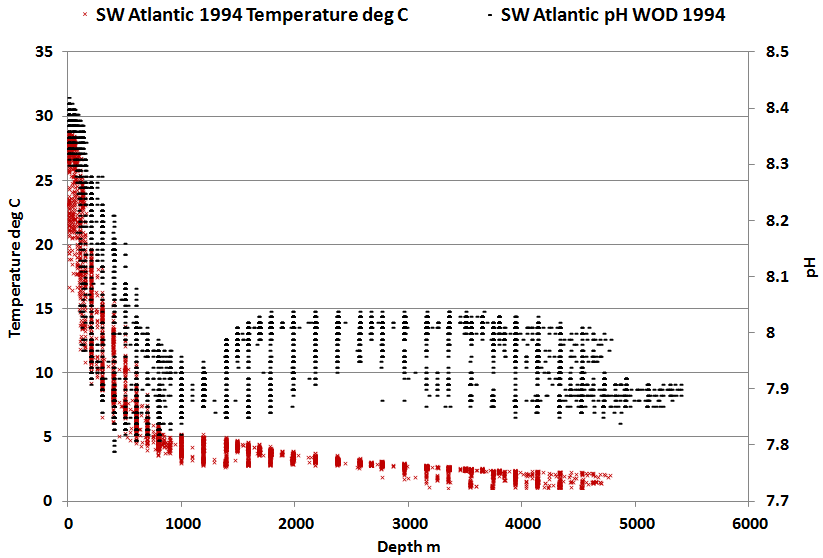
Finally, in the featured image I compared some regional pH values to a crude NOAA characterization of global temperature with depth. I can use the WOD to extract temperature values for the same depths, locations and times as used to derive the pH values. The next chart informally illustrates the result for the Southwest Atlantic series again for 1994 as an example. In this case I’ve flipped the axis to facilitate convenient comparison within excel. Typically I like to standardize when comparing multiple time series. I haven’t reached that stage yet and so my axes limits are somewhat arbitrary. Even so and again it is evident that the NOAA WOD ocean pH values compare fairly well to the corresponding ocean temperature values, especially in this case within the first kilometer of depth.
I’ve looked at other profiles at random, and so far the fidelity of the NOAA WOD pH series to thermoclinic observations appears to resonate, no matter how the information is sliced.
The rich connections between ocean pH and thermoclinic patterns might be of growing interest to many. They are of continued interest to me as I explore equivalent thermocline profiles in the atmosphere, namely the temperature inflection at the tropopause, where a tropopause can be found. Other independent papers also explore the apparent similarities and as I infer, the symmetry limits in temperature signatures across the atmospheric thickness and the thickness of the oceans, including Smirnov (2018) [1].
[1] B M Smirnov. 2018. Collision and radiative processes in emission of atmospheric carbon dioxide. Journal of Physics D: Applied Phys. 51 214004