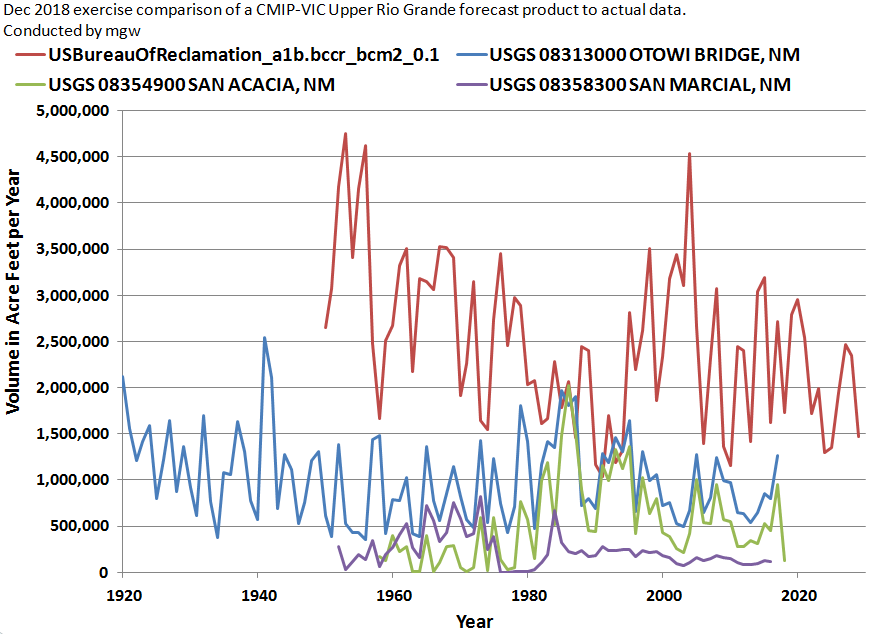
The red curve in the featured image demonstrates a typical US Bureau of Reclamation (USBR) streamflow simulation result for the upper Rio Grande. It is one of 112 runs that they conducted for this stream segment alone. I have featured their simulations in an earlier post from 2017 because I found it interesting how their accuracy compared to my own solar based streamflow prediction content, as well as to real world observations [1,2]. Accordingly, the other three time series are actual US Geological Survey (USGS) based observations for three Rio Grande stream gages which cover the same region, in descending order from north to south they are the Otowi in blue to the downstream San Acacia in green to San Marcial in purple.
Obviously the further downstream a watershed is followed, the greater the area of the upstream catchment. It is clear to see from this information that even as the total Rio Grande watershed area grows downstream, each subsequent gage, from Otowi to San Marcial shows a general progress to lower flows. That is a typical pattern in the arid West of course, as streams emerge from high mountain catchments into vast drylands where irrigation and municipal uses are also at play (and even when they are not). These time series are also featured in at least one other post of mine [3] and I reproduce one image below which exemplifies the intricate similarities between the San Acacia and Otowi flows.
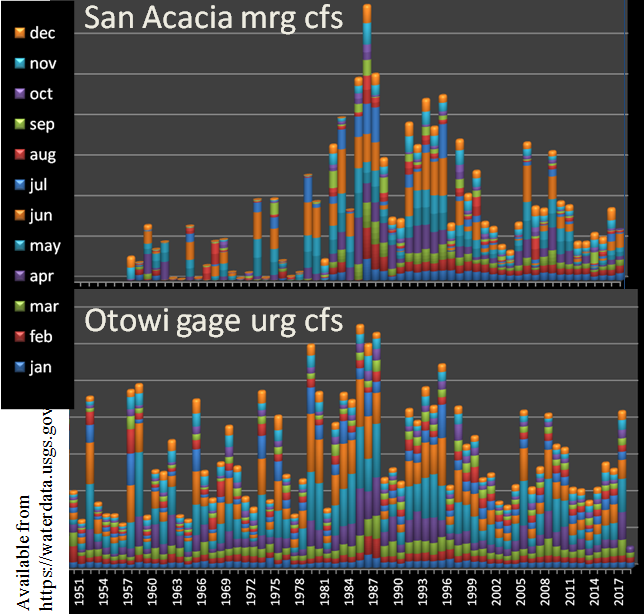
Many of the monthly compounded flows are interesting and featured at this post in more detail.
Judging by the USBR’s red time series in the featured image at the top of this post, the irrigators of the Rio Grande watershed, along with a host of agencies and professionals in natural resources, earth sciences, biological sciences and engineering would be interested to understand more. The US Bureau of Reclamation has apparently determined that the Rio Grande in Central New Mexico produces on average several million additional acre feet of water per year, above and beyond what the official USGS streamflow records have indicated. It would be most consequential news in this dry state, especially since the new flow rates are a few hundred percent more than the status quo of mere observations.
After reviewing additional modeled stream cases, along with a series of open discussions with the Bureau of Reclamation Science Adviser [4] and other related scientists, I can confirm that the red curve is not an anomaly. Rather it appears that the thousands of recent USBR Western streamflow simulations are each similarly detached from the reality of observations. Given that deficiency, this might not be the Bureau of Reclamation’s finest decade. My anticipation is that regardless of their current stance, the Bureau will soon return to the basic standards of scientific practice that their public is entitled to, and will retract the use of any of these streamflow simulations for any purpose.
On the other hand, if the Bureau continues to support these models, then many of the irrigators, agencies and others will likely soon demand their share of this miraculous water resource.
REFERENCES
[1] Wallace, M.G. 2017. Preliminary evaluation of West-Wide Climate Risk Assessment Forecasts http://www.abeqas.com/preliminary-evaluation-of-west-wide-climate-risk-assessment-hydroclimatology/
[2] http://www.abeqas.com/climate-forecasts-by-mwa/
[3] Wallace, M.G. 2018. Streamflow records along the Middle Rio Grande in New Mexico http://www.abeqas.com/the-san-acacia-gauge-in-the-middle-rio-grande/
[4] Personal communications with Dr. Raff, Science Adviser, US Bureau of Reclamation (draff@usbr.gov)