This will be my web site’s first guest post. Bernie McCune is a founding member of the Las Cruces Atmospheric Forum and practiced quantitative instrumental pyrheliometry for many years. I’ve learned a lot from Bernie and think he can help many to wrap their brains around some of long term climate’s possible connections. Many thanks to Bernie and his supporting frameworks within southern NM. Here is his piece:
The Effect of Water Vapor and Clouds on Temperature by Bernie McCune
I worked at the White Sands Missile Range solar furnace, which is located in the Chihuahuan desert of New Mexico, in the early 1980s. Daily solar input to the surface at the furnace location was measured with an Eppley pyrheliometer. The instrument was calibrated on a regular basis and the shortwave solar input value to the surface was measured in watts/m2 at the top of the furnace attenuator array.
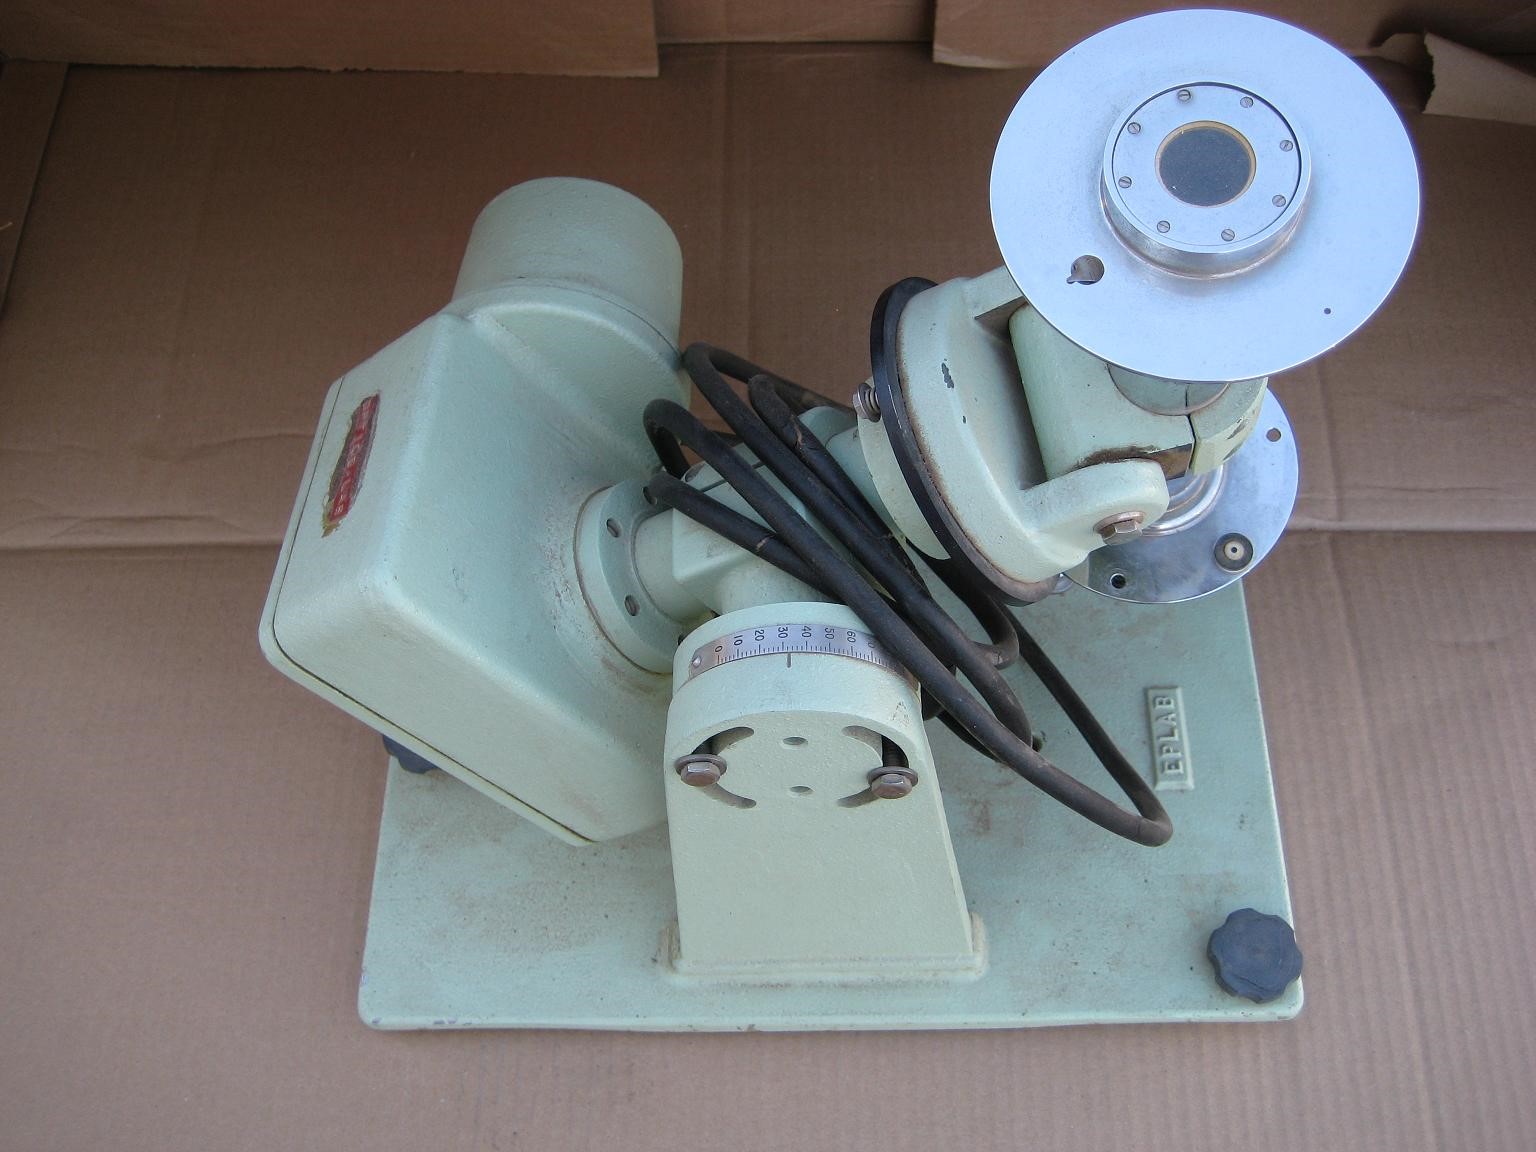
Figure 1. (featured photo) Picture of Solar Furnace Eppley pyrheliometer. Note the equatorial style tracking mount and clock drive.
Seasonal solar noon readings gave us some interesting data. Readings during the summer monsoon rainy season on cloudless humid days averaged about 850 watts/m2, while during the very dry autumn days at solar noon they were from .. watts/m2 to up to .. watts/m2. Mike W. note: This seems reasonable to me, given that Wikipedia reports that avg daily TSI at sea level on a clear day is expected to be about 1000 watts/m2.
Figure 2 Picture of WSMR Solar Furnace
at: https://www.army.mil/article/37355/solar_furnace_could_save_earth
The high water-vapor content during the apparently clear days in the summer monsoon months significantly decreased solar input, while the very dry autumn fall and winter months allowed a large amount of solar energy to reach the earth’s surface. CO2 radiative effects are apparently about 3 watts/m2 max. Thick clouds decreased the Eppley readings to zero. Very thin clouds and jet contrails dropped overall readings..
Clearly effects from clouds and water vapor have a very large direct effect on incoming solar short wave radiation before any kind of long wave radiative effects from CO2 can be seen. At night especially in the desert southwest clouds can be a very large factor in reducing radiative heat to space which on normally clear nights lose heat rapidly and turns cool in summer and very cold in winter.
Early morning and late afternoon readings (8am and 5pm) were quite low (down by half or more as seen in plots at the end of this article) even in the summer months. On clear autumn mornings Eppley readings could be seen rising very quickly once the sun had risen a few tens of degrees above the horizon. Obviously atmospheric content near the surface at the horizon does affect the readings.
Volcanic Eruptions of El Chichon 1982
The gases and aerosols from this volcano were blown so high into the atmosphere that they stayed up and were carried in a world wide pattern that lasted for more than a year. Within 3 weeks the stratospheric cloud had spread all around the world. Normal Eppley readings in the spring of 1981 were compared to those of the spring of 1982 when El Chichon erupted and we noticed immediately that the difference in those readings dropped by 100 watts/m2 and stayed close to that value for more than a year. Equatorial eruptions of this sort seem to put lots of material very high in the stratosphere and due to the nature of the winds aloft keep it up for a long time. Mike W. note: That’s very interesting!
Clearly these blocking mechanisms can cause a very large decrease in short wave incoming solar radiation. Whatever fairly small radiative reduction of the reflected radiation by CO2 of outgoing radiation is further diminished by this significant decrease in the incoming radiation from the sun
About the Furnace
The furnace was originally at Natick, Massachusetts but was moved to WSMR due to a much more favorable solar environment. On a good day at noon the furnace can collect up to .. kilowatts of solar thermal energy in the small spot at the focus for about .. hours continuously. The structure just to the left of the test building is the attenuator shutter blind assembly. … Adjusting the shutters can control energy levels from 0 to 100% in small measurable increments.
Among other tasks, solar energy projects for emerging technologies were carried out at the furnace. One unusual project was solar high temperature extraction of oil from shale. This was well before the practice of fracking of in-situ shale formations was found to liberate much of the oil from those deep and high-pressured fractured structures. A number of tests of high-temperature ceramic and foam protective materials were done at the furnace. Space shuttle tiles were also tested at the furnace.
Eppley NIP Specification
This instrument is a World Meteorological Organization (WMO) First Class Pyrheliometer designed for the measurement of solar radiation at normal incidence. The NIP incorporates a wire-wound thermopile at the base of a tube. The aperture subtends an angle of 5.725 degrees.
The sensitivity is approximately 8 micro volts/watts/m2. The temperature dependence is +/-1% over an ambient temperature range of -20 to +40o C. Linearity is +/-0.5% from 0 to 1400 W/m2
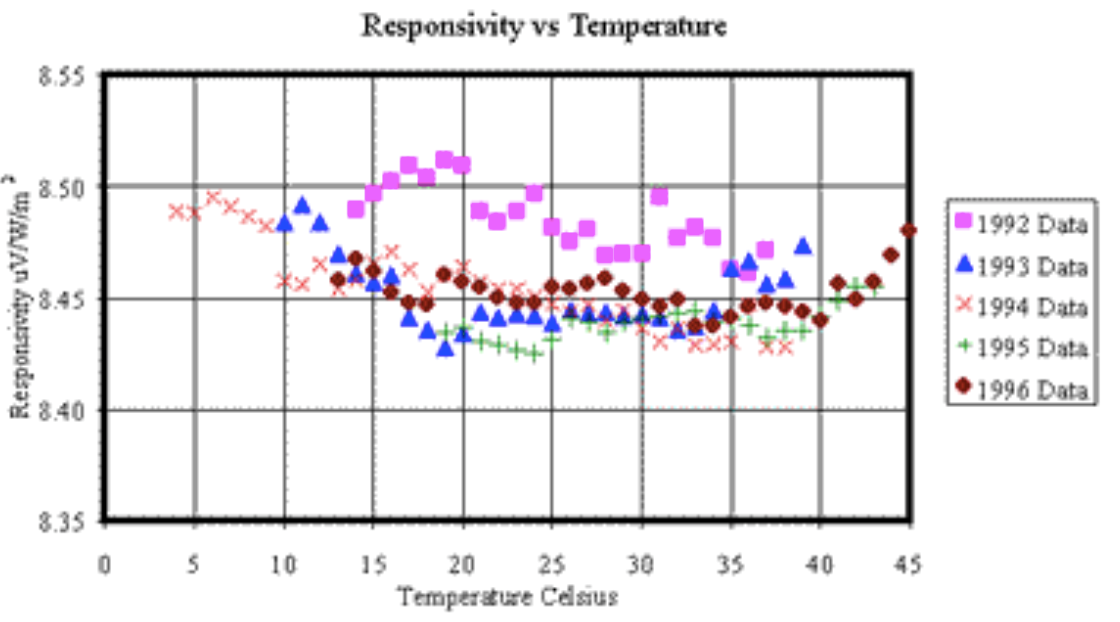
Mike’s notes: I am sold on this because the 1992 (magenta and higher overall) data was a peak year in sunspot numbers SSNs. .
Conclusion
I no longer have actual data charts since at the time that I worked at the furnace I really did not foresee any climate implications. Data like this is still being collected by NOAA SurfRAD sites: https://www.esrl.noaa.gov/gmd/grad/surfrad/
Here is a cloudless-day reading from one of the Colorado SurfRad sites.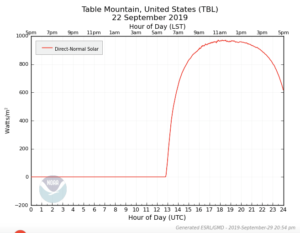
Given the superposition of both volcanic activity and summer water vapor, the TSI in the Las Cruces general area at the instrument’s elevation above the surface reaches above .. watts/m2 at solar noon. During the fall, plots might be 1000 to .. watts/m2 if the fall moisture content drops to very low levels.
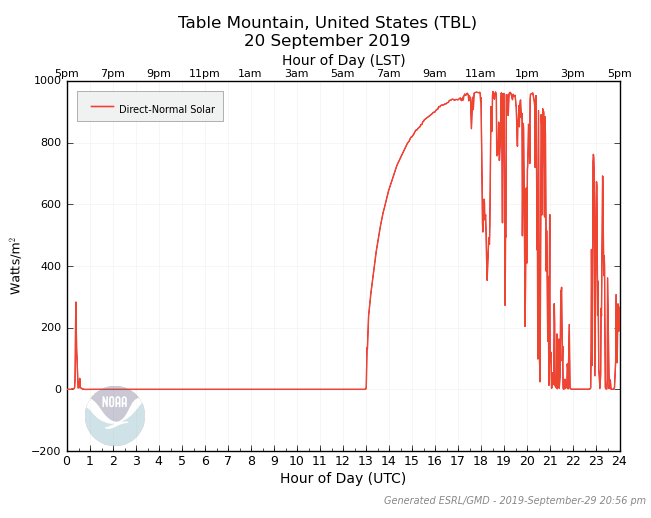
A few days before the above image was taken, in the next plot, is shown the dramatic effects of clouds. An integrated value of solar input for this 20 September plot might be lower by 50% than it would be for the plot two days later shown within the previous image.
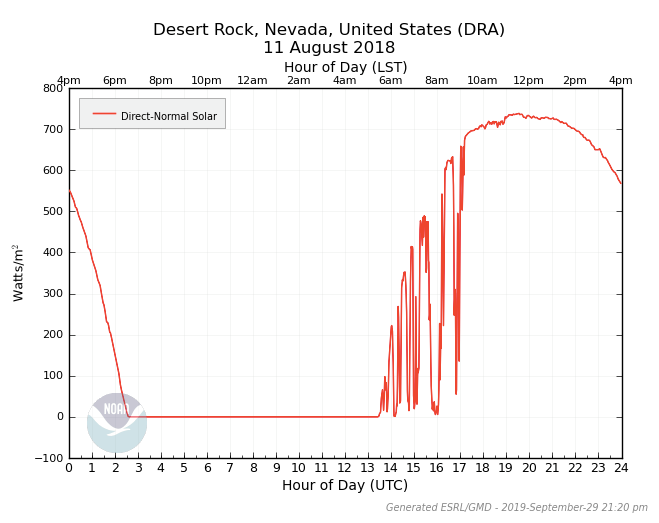
Here’s an August plot for last year from Nevada