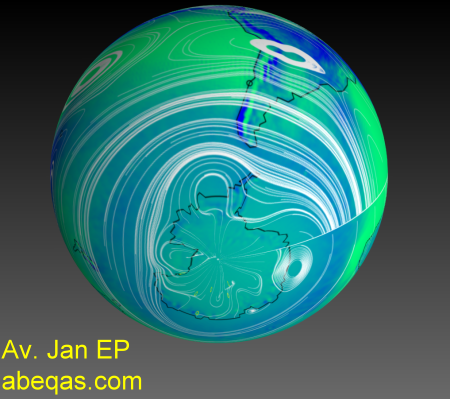
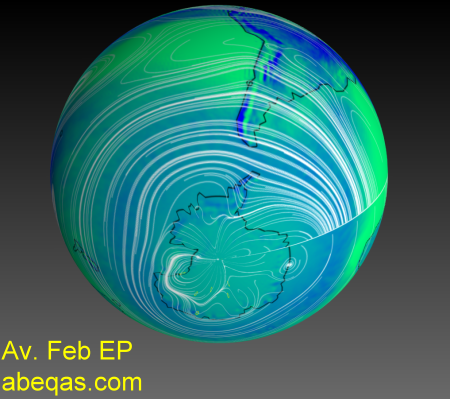
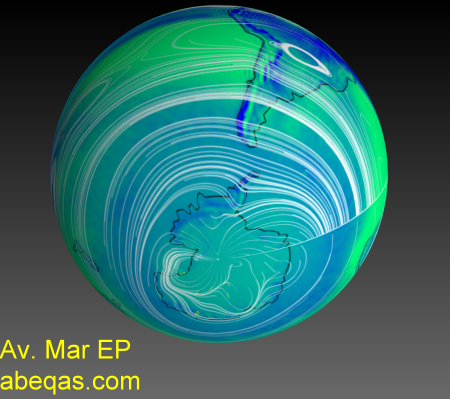
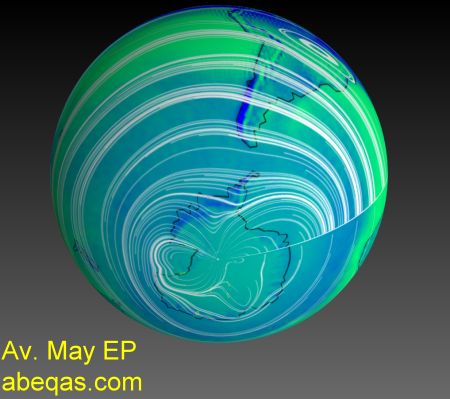
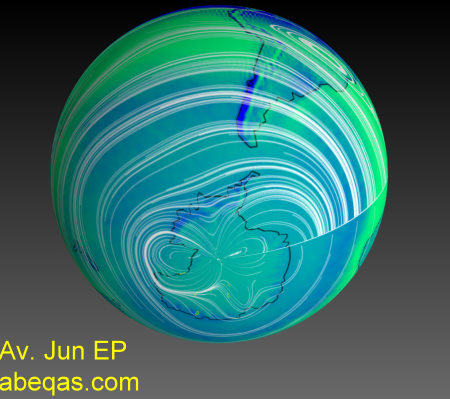
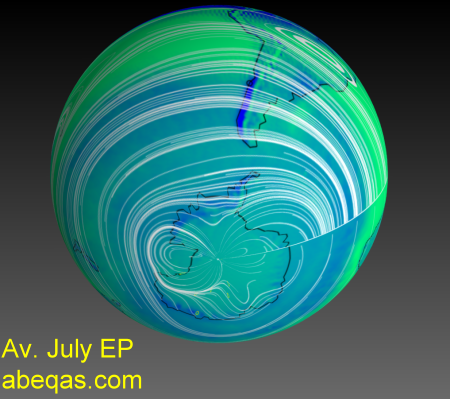
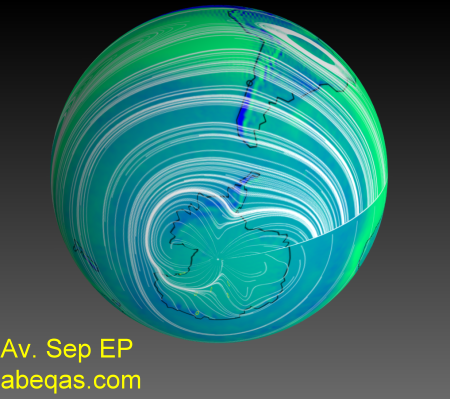
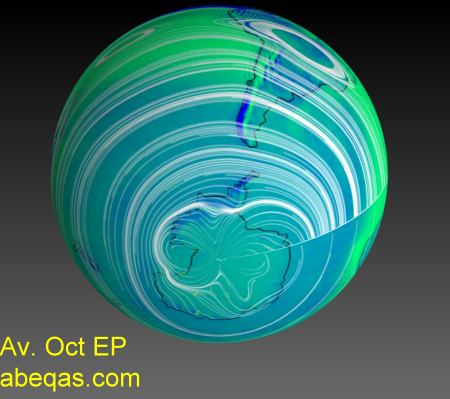
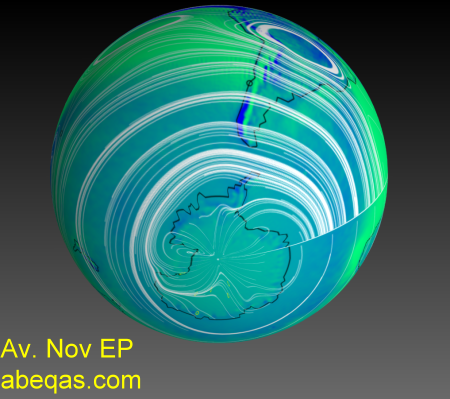
Previous and future posts provide the context for this featured animation. It renders 12 frames, one per month for the average UCAR ERAI full atmosphere thickness integration from 1979 through 2014. The white streamlines reflect geostrophic zonal and meridional velocities. Antarctic stations shown include South Pole, Dome A, Dome C, Taylor Dome, Vostok, Law Dome and Siple Station. The background surface image renders precipitation (blue range) vs evaporation (green range) intensity.
Here are frames for each month.


Discussion
The austral winter contraction in the hydrogeostrophic atmospheric appears to relax approximately each November. Maybe that contraction is a driver at least in part for ozone patterns. This is only a blog and content is still a work in progress.