I return again to comparing climates of Tropical regions (Honolulu, Hawaii) versus climates of Temperate regions (Albuquerque, NM). I’ve explored both many times at this site. I start with the above wind rose diagram based on the most accessible and easy-to-use Wind Rose Dataset from [1]
As always, I’m fascinated by the differences between trade wind patterns for tropical regions (Honolulu) and the more westerly, continental, and monsoonal patterns for the Southern Rockies (Albuquerque).
Many might have much to say about this particular side by side monthly comparison of their climatological wind roses. I could say that Albuquerque’s patterns seem more or less in line with their full atmospheric thickness geostrophic wind patterns. But given the predominant Easterly trade wind flows over Honolulu demonstrated by the windrose above, one might struggle to reconcile that with so-called atmospheric rivers and other notions in which atmospheric moisture strafes Hawaii’s footprint and then proceeds to migrate East towards the Western US (often somewhat south of where Albuquerque happens to be located).
I certainly have struggled with that. Among other related puzzles, I am quite interested to understand Hawaii’s atmospheric wet spot. It is a quasi-stationary zone of nearly perpetual precipitation (for the geostrophic case of the full atmosphere integration) just east of Hawaii. It is accordingly a type of “dimple” or “trough” in the atmosphere. For lack of a better scientific attribution for now, I’ll just relate it to a belly button that is an “inny”. I’ve inserted an earlier exploration of mine below, noting that I only rendered the big island of that chain. The link above is more complete.
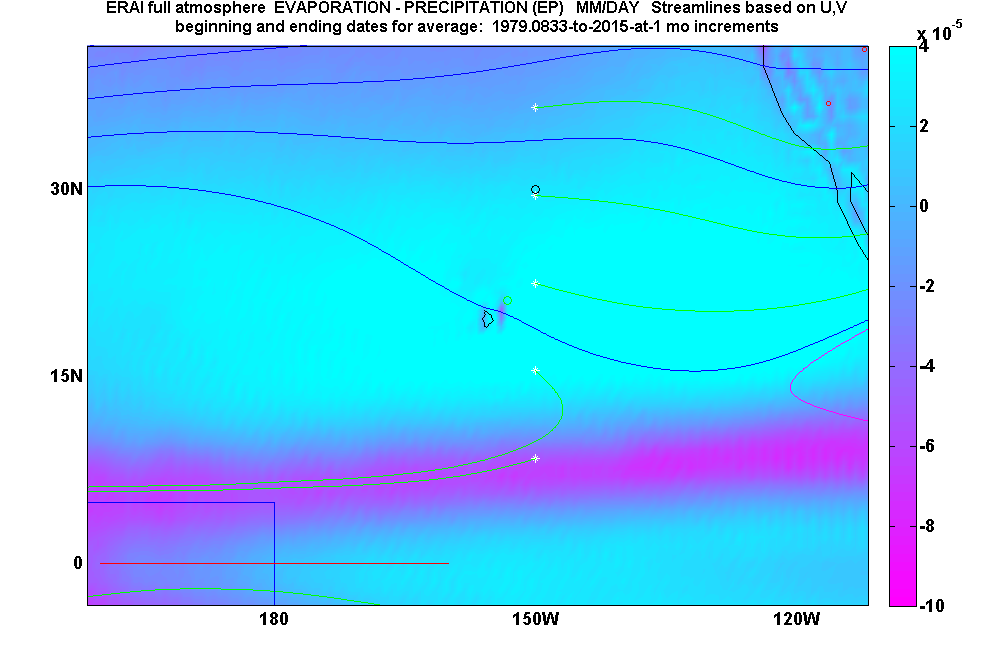
dark blue streamlines originate from the west of the image.
Perhaps someone has put an explanation of that wet spot and the “windconsistency” between Hawaii and the Western US, into a tidy peer – reviewed package. So far the closest explanation (and still insufficient one) I can find is my own modest paper [2]. That paper also happens to be the first paper ever to synthesize solar forcing of climate from the bottom to the top of the atmosphere and to use that synthesis to produce the world’s most accurate climate forecasts to date. But I digressed.
So I have now introduced some “dialectical data” material, Hawaii versus New Mexico. They are not the same, and although the winds appear to blow from Hawaii, away from New Mexico, the atmospheric moisture does not appear to share that same trajectory. And yet, the wind patterns for both locations are fully consistent with the theories and demonstrations featured in [2].
I have a priority climate project which can slow down some of this idle blog progress (and I’m lucky to have that problem). I’ll supplement this post soon with relevant comparisons of each wind rose frame to geostrophic and surface winds. I’ll wind it up with that missing explanation. It could be tidier than one might think, if one ever bothered to puzzle about it (which few or no other researchers have).
[more content will be added this week so please check back]
References
[1] https://www.wcc.nrcs.usda.gov/climate/windrose.html
[2] Wallace, M.G., 2019, Application of lagged correlations between solar cycles and hydrosphere components towards sub-decadal forecasts of streamflows in the Western US. Hydrological Sciences Journal, Oxford UK Volume 64 Issue 2. doi: 10.1080/02626667.2019.