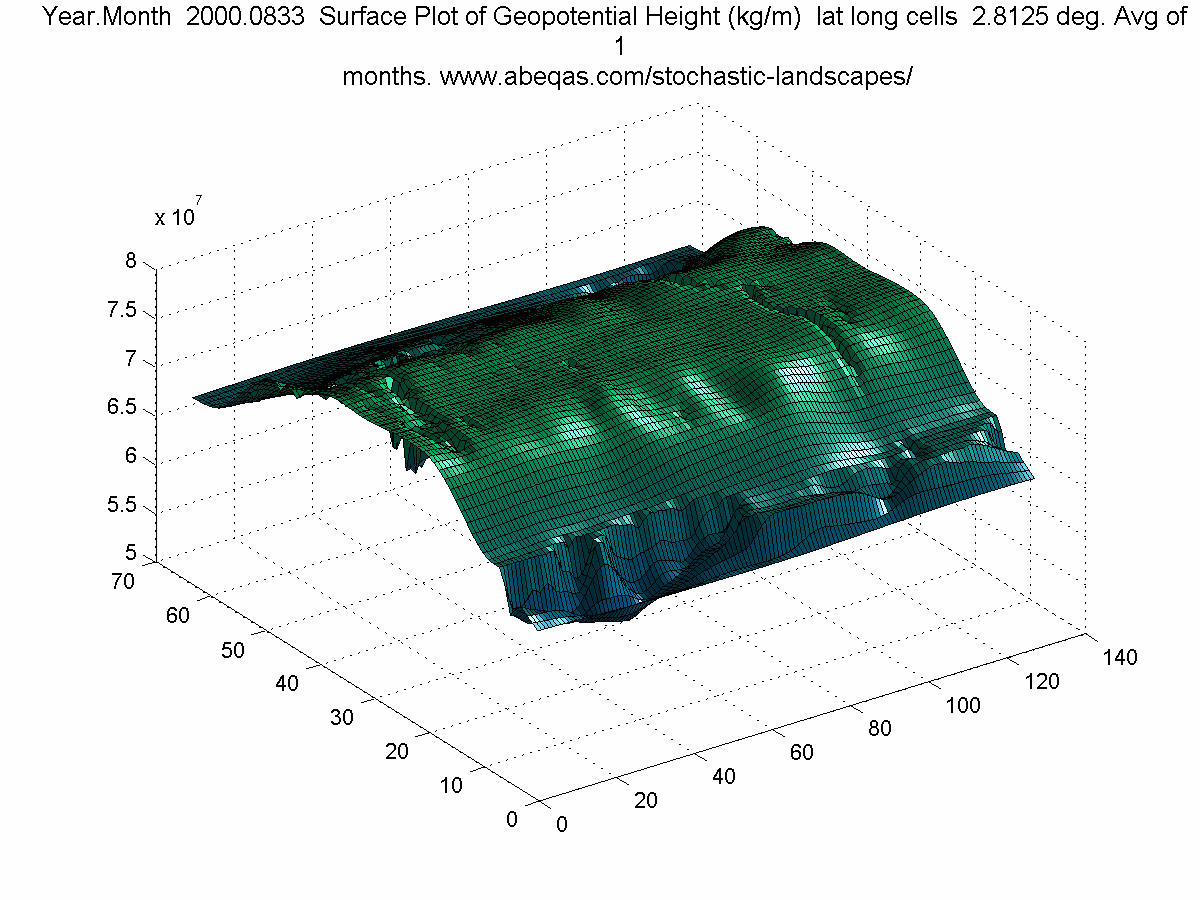
The Solar Mountain is a phenomenon that can be characterized quantitatively from the perspective of a harmonic stochastic landscape. Think of the featured surface above as an undulating map of the world. Just as we were all taught in school about the Mercator projection, one could “fold” this map over an orange and it would then appear as a bumpy and creased Earth. For orientation, one can start at the right half. The crooked N to S crease is actually the impact of the Rocky Mountain Cordillera of the Western Hemisphere, which stretches from the northern extremes to the southern extreme of that continental pair. Every once in a while (summer months) Greenland is visible in the far upper right, while Antarctica stretches across the bottom. You can see the surface of Antarctica projecting out from the map’s base surface. The rest of the features should be easy to identify, such as Africa to the left.
Naturally this is not an ordinary map but it is nothing extraordinary either. It is simply a surface plot for the Earth of the geopotential height (Z) of the full atmosphere. The undulations simply reflect the changing values of an atmospheric pressure parameter with each month over a particular year (2000 in this case). Moreover, those undulations reflect temperature as well, by virtue of the hypsometric equation.
Accordingly, this map conveniently merges pressure, elevation and temperature into one parameter. As the predecessor post to this one demonstrates, the Solar Mountain exhibits persistence across many scales and modes. The subject observation – based animation also suggests harmonic behaviors of gyre migrations although only finer time scales could hope to confirm that speculation. Also the great tropical ocean gyres straddling the equator are now visualized perhaps for the first time, as the “foothills” to the Solar Mountain. Much remains to be explored towards unlocking the potential.
For one example, the consequence of the EW major “valley” within the highest plateau of the solar mountain may simply be from the curious linear consequence of the QG full atmosphere approach at the appropriate synoptic scales. The increased concentration on average of the lower pressure water vapor has manifested into this hanging valley. The blue contours of the lower-left profile image below from the host University of Wisconsin web page, are suggestive of what such a water vapor volume contribution to the Solar Mountain might look like in general profile mode.
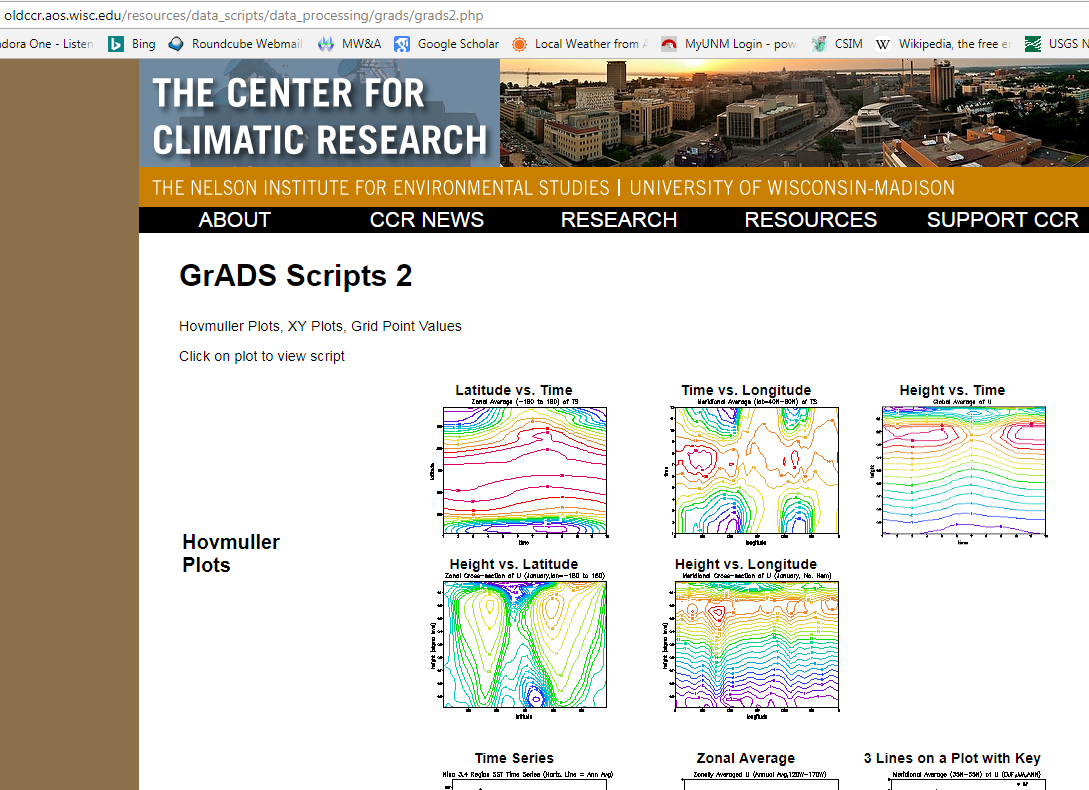 Image Source: http://oldccr.aos.wisc.edu/resources/data_scripts/data_processing/grads/grads2.php
This is a work in progress and an opinion piece. Also, I have introduced the term “Solar Mountain” and so far as I know, no other sources have characterized the geopotential surface in this way.