by Michael Wallace | Oct 25, 2019 | Uncategorized
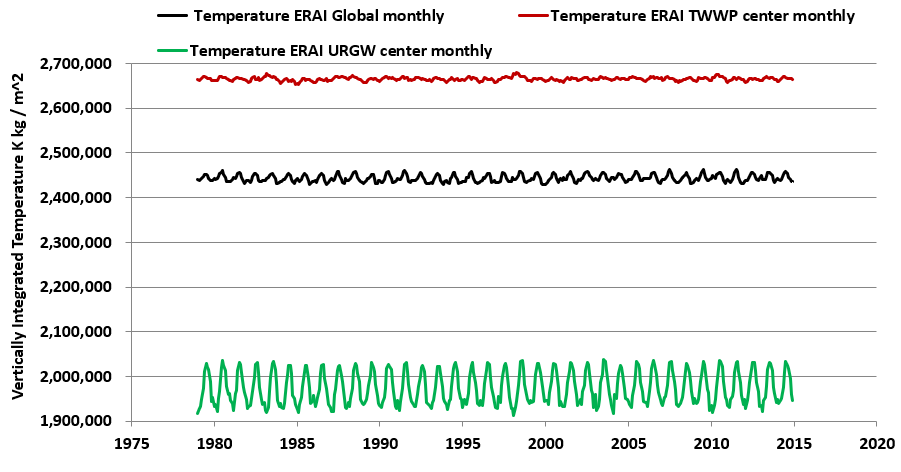
The featured chart is based purely on satellite reanalysis data, integrated across the full thickness of Earth’s atmosphere, over 36 years (432 months, from 1979 through 2014), for 3 samples. I didn’t modify this data in any way. The black curve captures...
by Michael Wallace | Oct 20, 2019 | Uncategorized
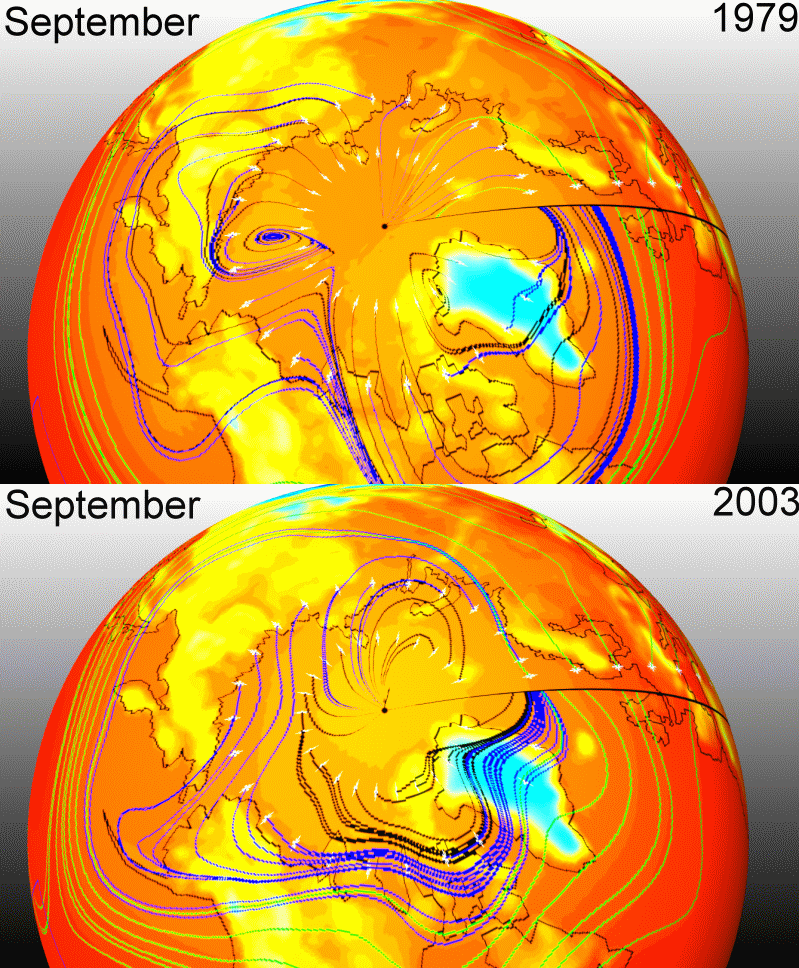
Experts routinely assert that polar ice extents each September capture something critical, dire, and apparently obvious about global temperature trends. But none of that can be reconciled with some observations which actually are obvious: When winds* diverge from the...
by Michael Wallace | Oct 16, 2019 | Uncategorized
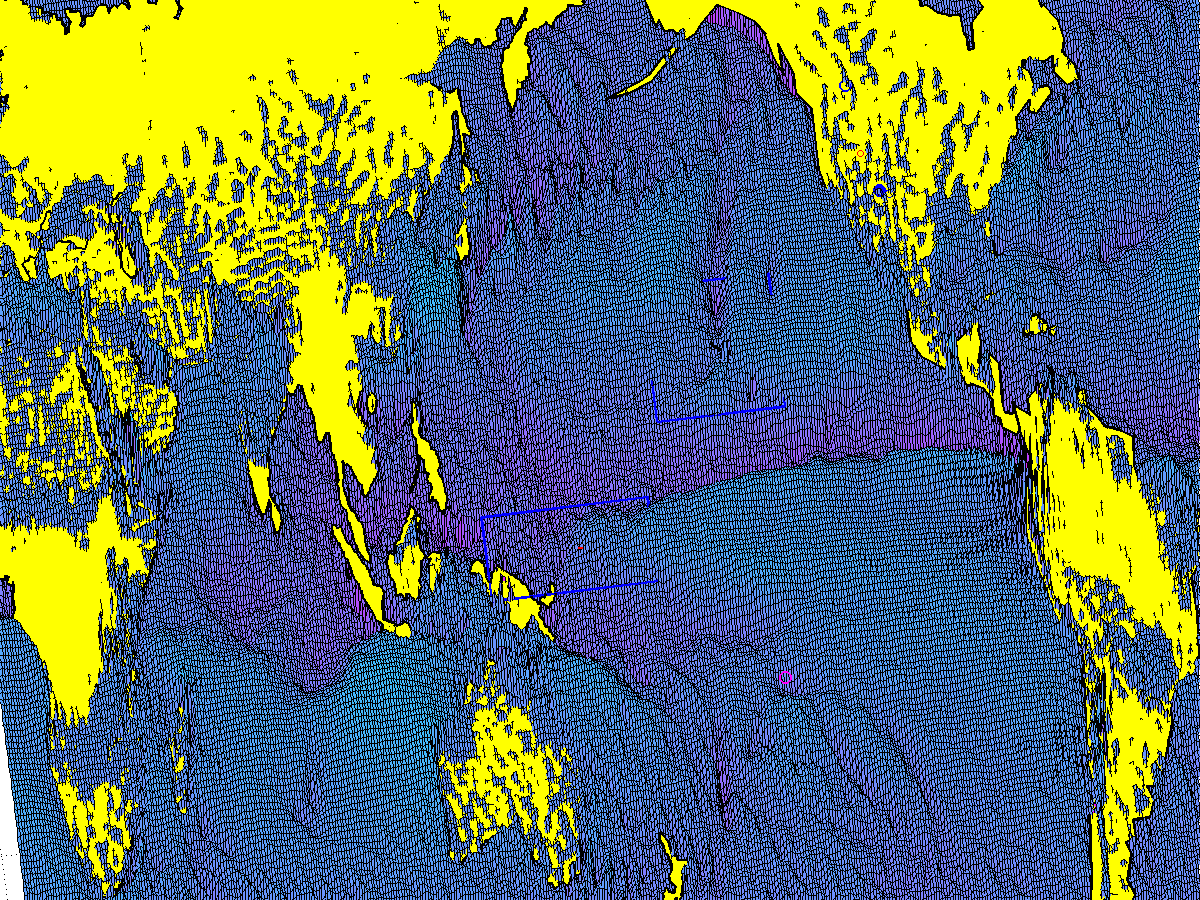
Why does moisture seem to travel through our planet’s atmosphere with such a mind of its own? In this example for full-thickness atmospheric moisture for the month of October, 1989, the north-south aligned furrows and ridges (high precipitation and high...
