Update 7 January 2026. We have updated our forecasts to Jan 2026 through April 2026. We have modified some of our precursors because of the continual process improvement, but we will compare results of the forecasts below and the new ones on our site when the observations have become available and we have taken some time to process and analyze. A download of the new forecasts will be made available at this site shortly. It will be free to those who register.
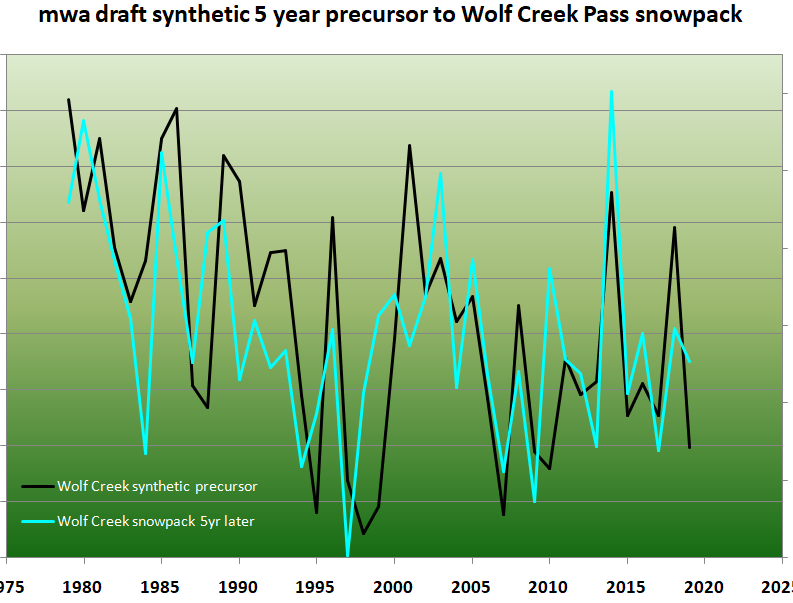
Original. The title image is from an earlier exercise that explored what the snowpack would be at Wolf Creek Pass (in south central Colorado) based on a lagged regression. That was several years ago. Now we’ve expanded on the principles behind that exercise to develop maps of the lagged correlation of a snow parameter to solar activity for zero and 1 year of lag, for both. Our foundation is the response of the parameter in lag-correlation space to solar activity. In the four draft product excerpts below, the darkest blues represent negative correlations of a snow index (specific snow water content) and the deepest reds signify positive correlations. The greater the magnitude, either positive or negative, the greater the chances of predictive success with any solar based projection.

Solar activity peaked last year, but the correlations are not strong almost anywhere for the first two months of winter. All is not lost, as other parameters that relate, do have stronger correlations and we use those for fee based forecasts of snow and other parameters.
On the other hand, correlations seem much stronger for the Southwest US for the subsequent months of February and March. Accordingly February 2026 in that region might see less snow than average and March may see more snow than average. This has been a draft exercise. I’ll follow up at this site to compare to the resulting observations.

Updated 24 Nov, 2025. From the above content, a simple linear regression – based projection is possible. First it is essential to publish an observational baseline of the targeted parameter. The previous year is included. Here are associated draft observation sets for the prior winter:


Here are the draft mean values for each of the winter months:


And finally for this post, the draft projections we’ve developed using a simple regression step. No auto-regression was deployed.* In this regression exercise, solar activity plays an important role. We post these for demonstration purposes and to allow for transparent comparison to the eventual results that will arrive over the next five months:


Transparency throughout a demonstration forecast, is critical so that our methods can undergo continuous process improvement. Note that some of our forecasts are more private, but this is a demo. Even this demo does not reveal the actual full precursor set.
Readers can explore this draft content and perhaps find it helpful in their own interpretations for areas of interest. The content is unlike that of other snow forecasting services so it also provides a refreshing alternative to ponder this winter. This content is also integrated into our solar correlation atlas which additionally features temperature, specific humidity, winds, cloud cover and more for the same winter months.
Time will tell how this demonstration forecast turned out, and we will document that here also. In the meantime, we’ll continue to populate our atlas and refine the methods as always. A co-authored publication may be forthcoming which explores solar forcing of climate globally over decadal scales.
* Our demonstration didn’t deploy autoregression (AR), but at times we do use AR and machine-learning (AI). Any method that improves forecast performance and accuracy is always on the table in our wheelhouse.