by admin_37678 | Jul 30, 2022 | Uncategorized
All of my scientific products are continually re-hybridized from this blended blog model, where I get to practice talking to a wall, among other things. Sometimes I explore these notions also through Twitter and I’m noted there for intermittent discussions about...
by admin_37678 | Jul 21, 2022 | Uncategorized
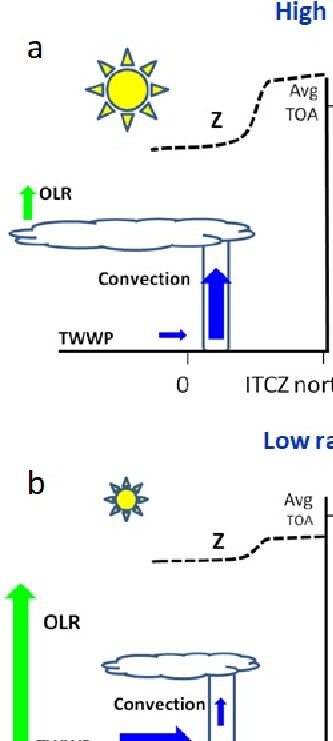
I’ve learned more from Fletcher et al (2020) about gas giants modulated by solar forcing [1]. As they note immediately in the publication: “What drives atmospheric circulation? Planetary atmospheres respond to differences in energy inputs as a...
by admin_37678 | May 18, 2022 | Uncategorized
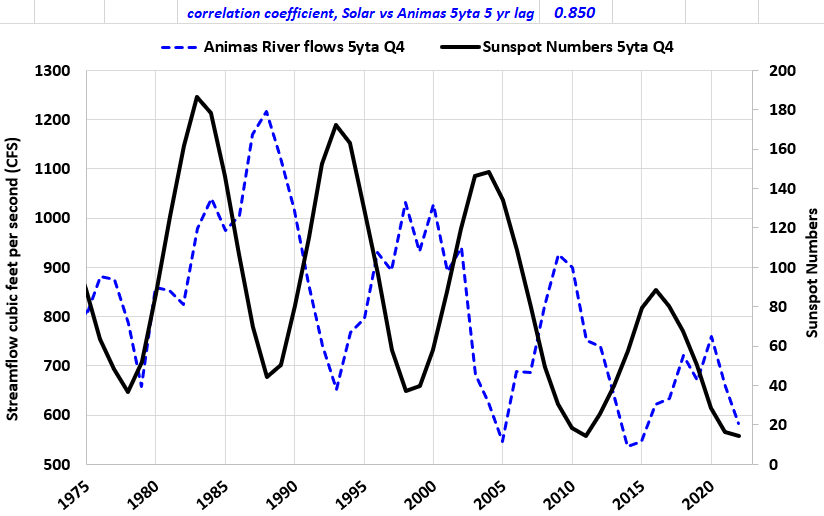
The featured image is an updated time series of sunspot numbers vs. streamflows of the Animas River at Farmington, NM. The Animas River is an important tributary of the greater Colorado River Basin. See [1] for an earlier exploration of these connections between...
by admin_37678 | Apr 20, 2022 | Uncategorized
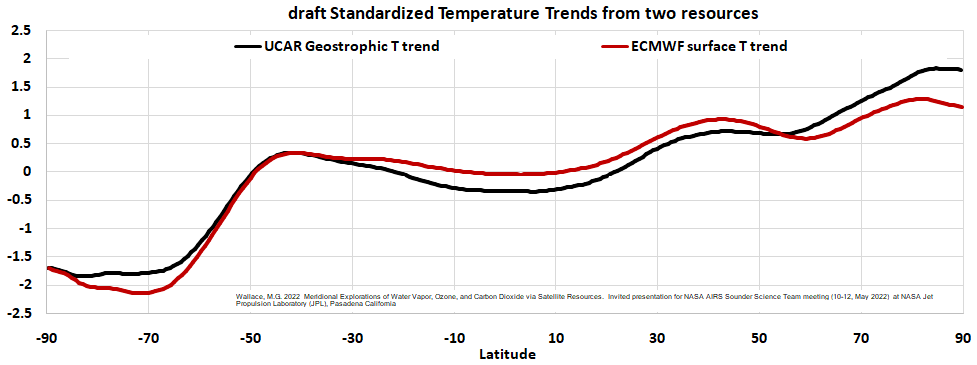
All working earth scientists seem to believe in anthropogenic Climate Change But where is the globe specifically warming, and where if anywhere is it cooling? And how much for both cases? You may think these are trivial to determine on the internet. This post will...
by admin_37678 | Apr 11, 2022 | Uncategorized
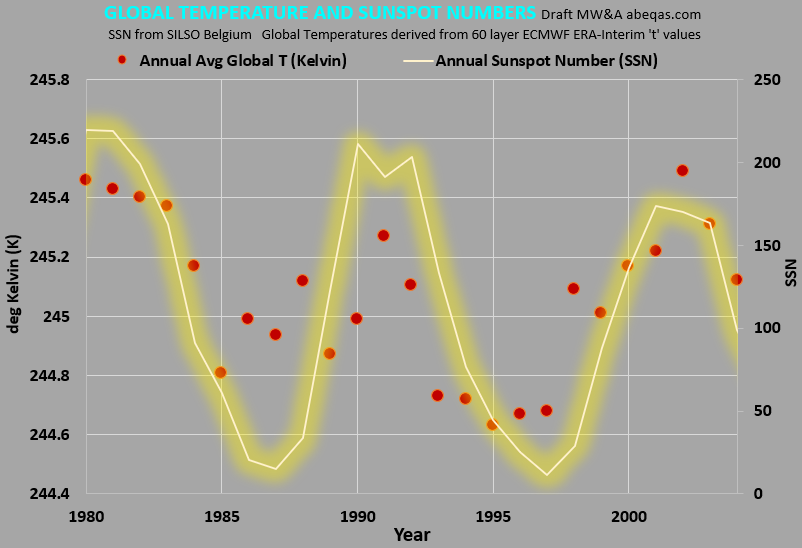
It seems apparent, at least from one profile exercise through the Earth’s atmosphere, that sunspot numbers express a statistically significant correlation to temperatures. The featured image demonstrates this and includes the minimal sourcing information needed...
by admin_37678 | Mar 16, 2022 | Uncategorized
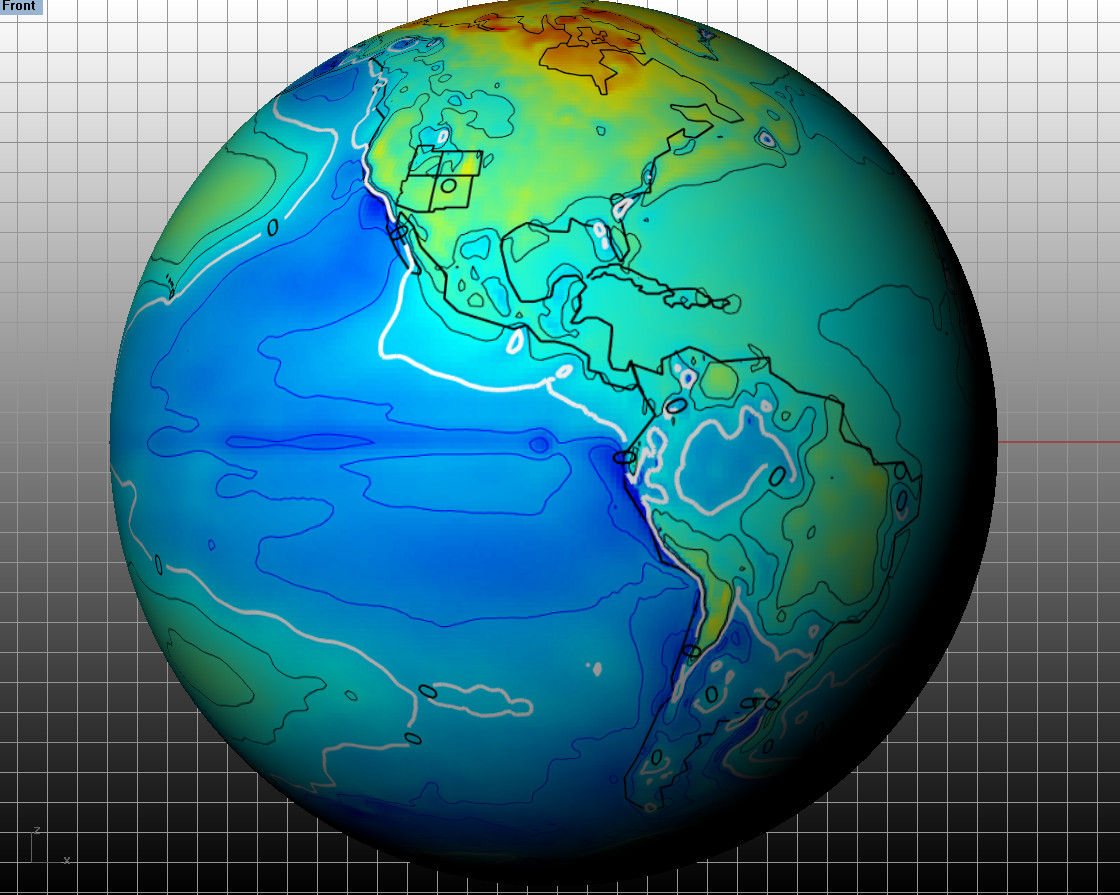
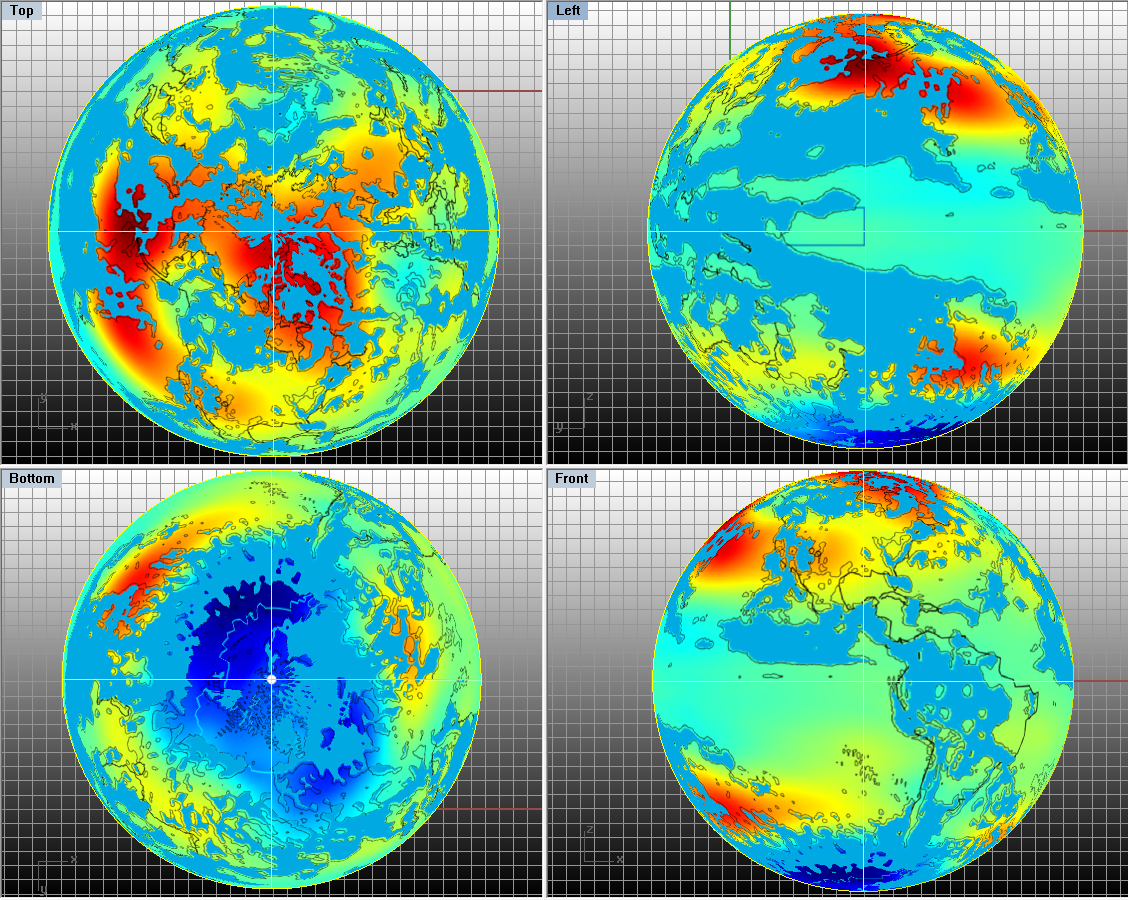
The color field captures ERA-I trends of Temperature over several decades. Red hues indicate the greatest temperature increases from 1979 through 2014. The blue-gray patches indicate where synoptic scaled precipitation has increased over the same time period. That...
